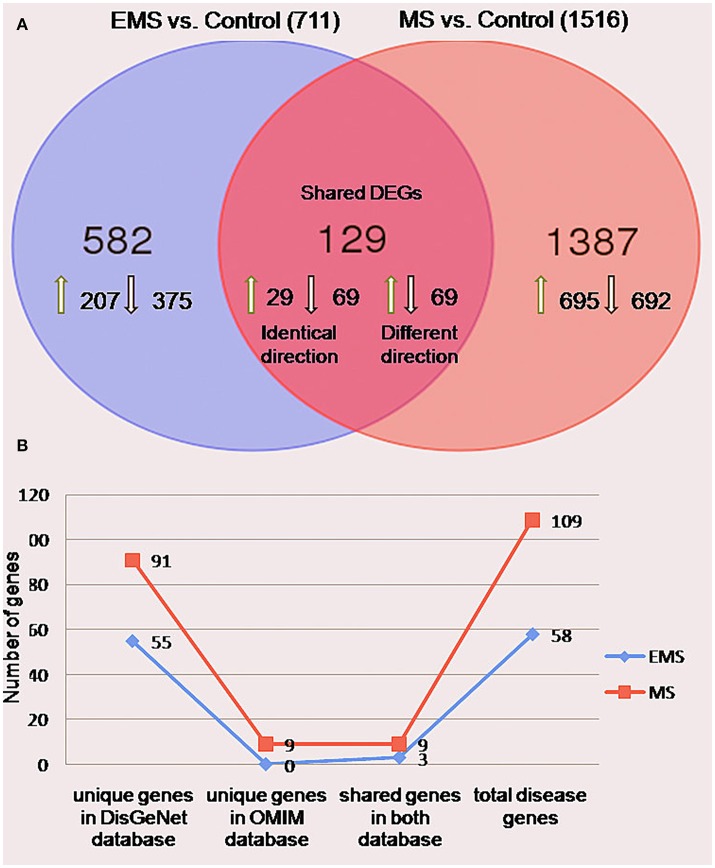
Figure 2.
Differentially expressed genes in the group of endometriosis vs. control and multiple sclerosis vs. control. (A) Venn diagram indicating the number of uniquely upregulated (green arrow) or downregulated (black arrow) genes compared individuals with EMS and MS to normal persons. The findings revealed 711 (32%) and 1516 (68%) genes in EMS and MS, respectively with 129 shared DEGs between them. (B) A line chart showed the occurrence of 58 (3%) and 109 (5%) genes in OMIM and DisGeNET disease databases.

