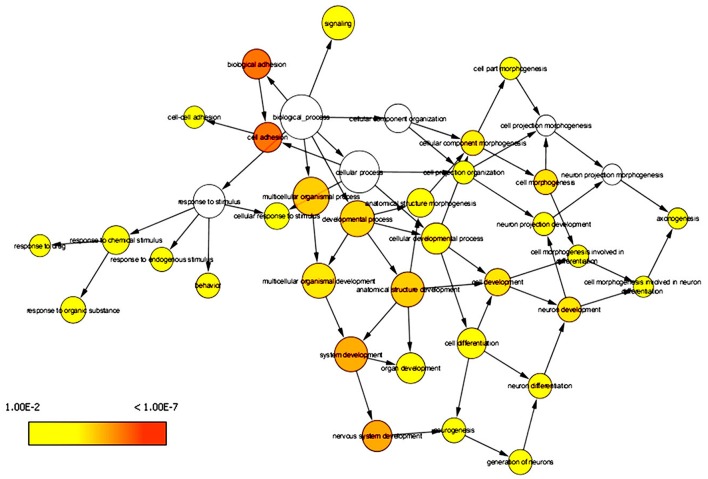
Figure 3.
Enrichment network of shared DEGs based on biological processes. Significantly overrepresented biological processes ontology terms were analyzed and visualized by Cytoscape plugin BiNGO. The structure of GO is described in terms of a graph, where each GO term is a node, and the relationships between the terms are edges indicating parent-to-child relationships. The size of a node is proportional to the number of targets in the GO category. The color denotes enrichment significance-the deeper the color on a color scale, the higher the enrichment significance.

