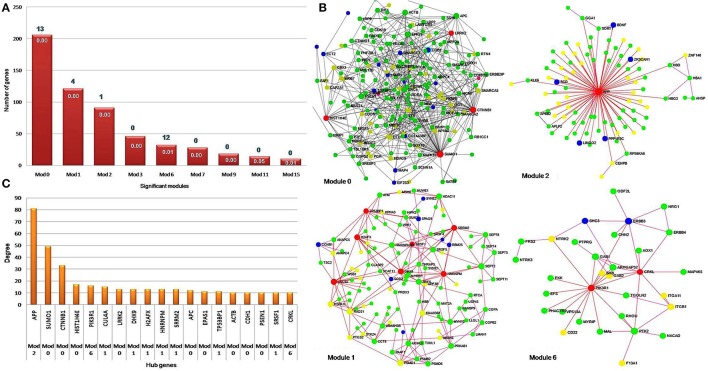
Figure 5.
Hub genes in significant network modules. (A) The column chart shows the size of significant modules based on the number of genes they contain. Four modules, namely zero, one, two and six were found to be enriched with 25 pathways. (B) The network modules show a high degree of clustering of proteins involved in the identical disease. The hub genes with high degree and high betweenness were denoted with red color. The EMS, MS, and shared DEGs in the PPI network modules were denoted by the color yellow, green and blue, respectively. (C) The bar diagram represents the distribution of hub genes with high degree i.e., hub genes ≥ 10 nodes. The hub gene APP (amyloid beta precursor protein) was found to be connected with the highest number of neighbor's node i.e., 81 in the network.

