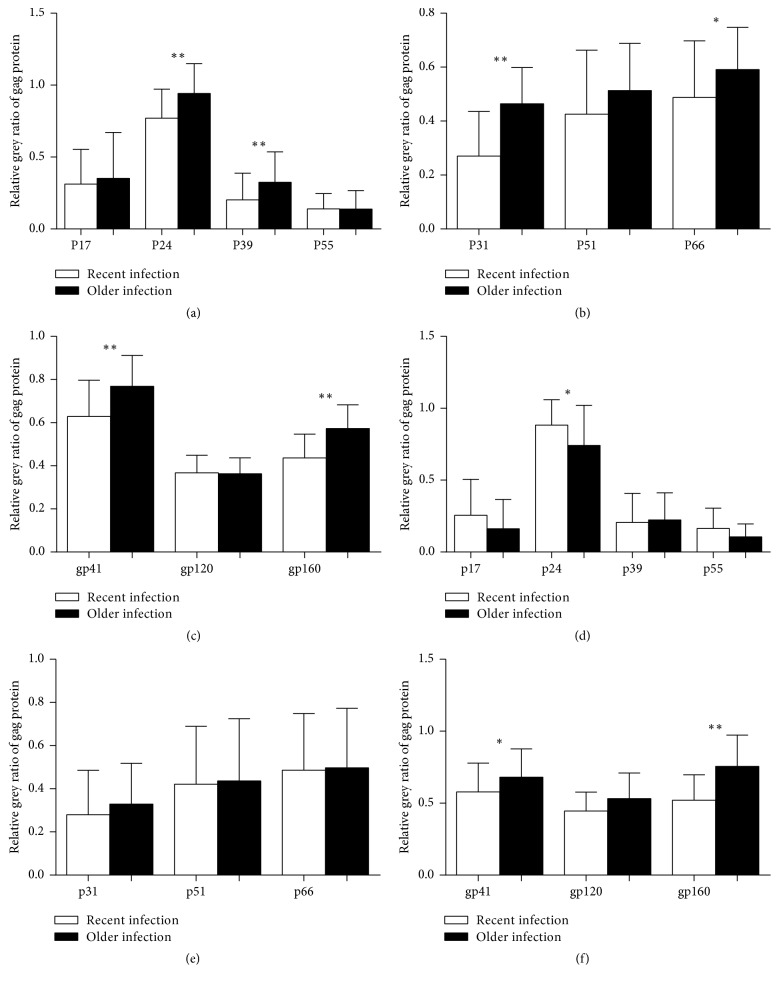
Figure 1.
Relative grey ratio of WB bands in recent infection and older infection group. WB bands were analysed using software AlphaView. Serum control of each sample was utilised as internal control of the corresponding sample. Normalized grey value was compared by the Mann–Whitney test. The bar graph was visualised by GraphPad Prism 5.0. (a–c) Normalized grey value of multiple WB bands in training set. (d–f) Normalized grey value of multiple WB bands in validation set (∗p < 0.05; ∗∗p < 0.01).

