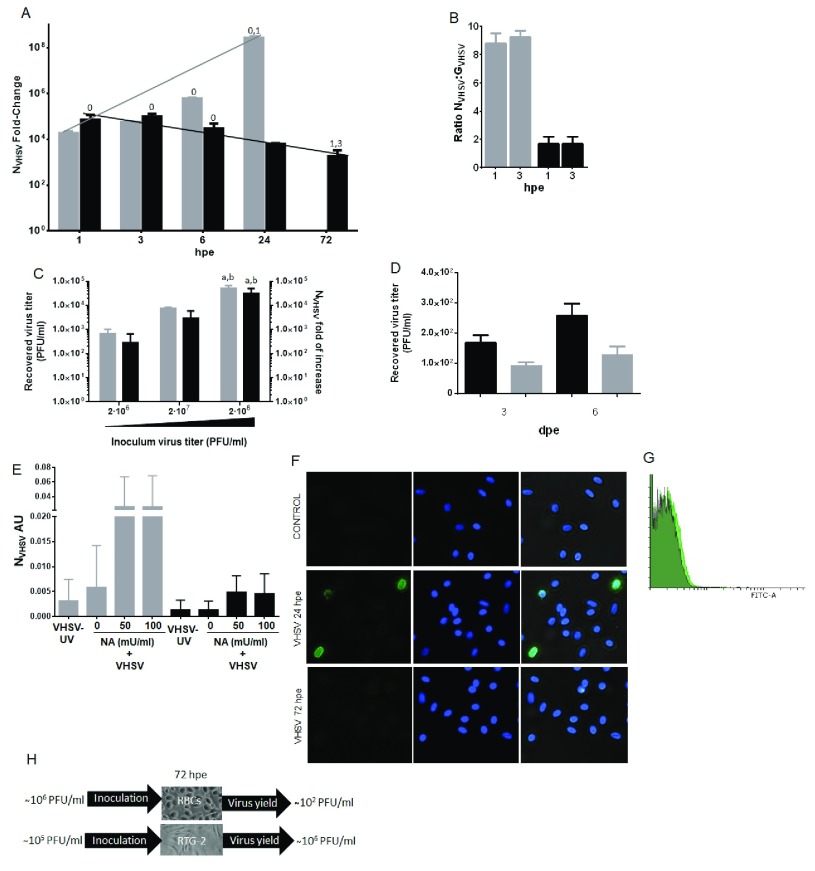
Figure 1. VHSV exposure and replication in rainbow trout RBCs.
( A) Time course of VHSV gene replication in rainbow trout RBCs and RTG-2 cell line. N gene of VHSV (N VHSV) expression profile was quantified by RT-qPCR at time 0, 1, 3, 6, 24 and 72 hours postexposure (hpe) to VHSV, in RBCs (black bars) and RTG-2 (grey bars), with a multiplicity of infection (MOI) of 1 at 14°C. Gene expression was normalized against eukaryotic 18S rRNA and ef1α, respectively for RBCs and RTG-2 cells, and relativized to control cells (non-exposed, time 0) (fold-change). Data represent the mean ± SD (n = 4 for RBCs and n=2 for RTG-2). ( B) Ratio of N VHSV and G VHSV genes expression by RT-qPCR at time 0, 1, and 3 hpe, relative to control cells (non-exposed, time 0), in RBCs (black bars) and RTG-2 (grey bars). Ratio was calculated as 2 −ΔΔCt N VHSV: 2 −ΔΔCt G VHSV. Gene expression was normalized against ef1α. Data represent the mean ± SD (n = 3 for RBCs and n=2 for RTG-2). ( C) Viral yield in VHSV-exposed rainbow trout RBCs. Viral titer (grey bars) (plaque forming units per millilitre, PFU/ml) and N VHSV gene expression by RT-qPCR (black bars) of VHSV-exposed RBCs, with MOI 1, 10 and 100, respectively corresponding to inoculum virus titers 2·10 6 ( a), 2·10 7 ( b) and 2·10 8 ( c) PFU/ml, 72 hpe, at 14°C. Gene expression was normalized against ef1α. Data represent the mean ± SD (n = 3 for viral titer and n=4 for N VHSV gene expression). ( D) VHSV titers diminished in rainbow trout RBCs after NH 4Cl treatment. VHSV titers obtained in VHSV-exposed RBCs at MOI 1, at 3 and 6 days postexposure (dpe), at 14°C, in the absence (black bars) or in the presence (grey bars) of NH 4Cl. Data represent the mean ± SD (n = 4). ( E) Pre-treatment of RBCs with neuraminidase enhances early replication of VHSV. RBCs were inoculated with UV-inactivated or live VHSV, with a MOI of 1, at 14°C. Before infection, cells were pretreated with neuraminidase (NA) at 50 or 100 mU/ml during 30 minutes at 14°C. VHSV infectivity was quantified by N VHSV gene expression analysis by RT-qPCR at 3 hpe (grey bars) and 72 hpe (black bars). Gene expression was normalized against 18S rRNA gene and represented as arbitrary units (AU). Data represent the mean ± SD (n = 4). ( F) Representative immunofluorescence of VHSV labelling in RBCs exposed to VHSV (MOI 100, 24 and 72 hpe, 14°C) stained from left to right with anti-N VHSV 2C9 (FITC), DAPI for nuclei stained and merged (IF representative of 32 images). ( G) Representative flow cytometry overlay histograms showing untreated RBCs (grey filled histogram), VHSV-exposed RBCs with a MOI 100, at 14°C, 24 hpe (green filled histogram) and 72 hpe (black filled histogram). ( H) Schematic representation of the VHSV infectivity in RBCs and RTG-2 cells, indicating the virus inoculation titer and recovered virus yield after 72 hpe in each cell line. Kruskal-Wallis Test with Dunn´s Multiple Comparison post-hoc test was performed for statistical analysis among all conditions. Values over the bars denote pairwise significant differences with the value-indicated time point or condition ( P-value < 0.05).

