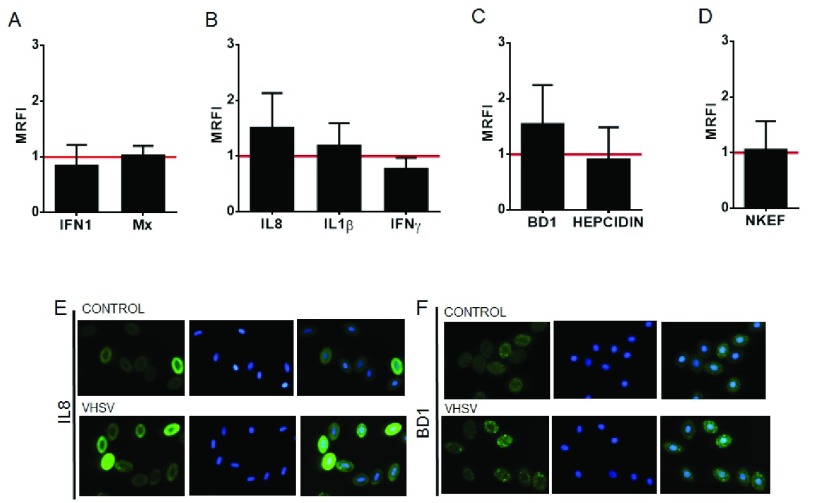
Figure 3. Immune protein responses of VHSV-exposed RBCs.
Relative immune protein expression levels, ( A) interferon pathway related proteins (IFN1 and Mx), ( B) cytokines (IL8, IL1β and IFNγ), ( C) antimicrobial peptides (BD1 and Hepcidin) and ( D) antioxidant protein NKEF, measured by flow cytometry and calculated by the formula MRFI (Mean Relative Fluorescence Intensity) = fluorescence in VHSV-exposed RBCs / fluorescence in non-exposed RBCs, at multiplicity of infection (MOI) 1, 72 hours postexposure (hpe), at 14°C, relative to control cells (non-exposed, red line). Data is displayed as mean ± SD (n=5). Mann Whitney Test was performed for statistical analysis between the VHSV-exposed cells and control cells. Representative immunofluorescences of control and VHSV-exposed RBCs stained with anti-IL8 (IF representative of 44 images) ( E) and anti-BD1 (IF representative of 46 images) ( F) (FITC) and DAPI for nuclei stain.

