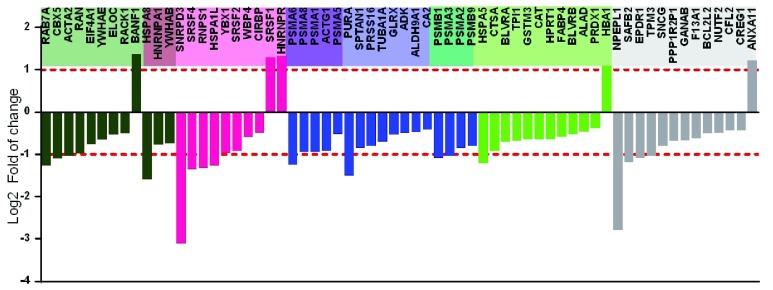
Figure 6. iTRAQ-based quantitative protein expression profile of VHSV-exposed rainbow trout RBCs.
Bar plot of statistically significant differentially expressed proteins in VHSV-exposed RBCs (MOI 1, 14°C, 72 hpe) compared to control cells (non-exposed) ( P-value < 0.05, FDR q-value < 0.05). Functional categories are labelled as follows: Blue = proteasome, pink = regulation of RNA stability, light green = cellular catabolic process, dark green= viral process, grey = proteins not associated to any function.

