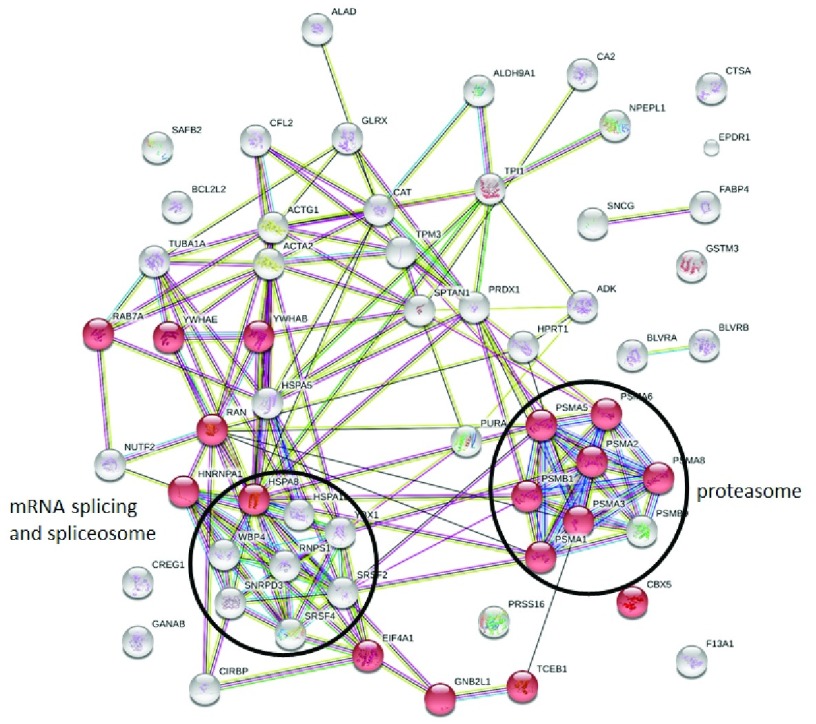
Figure 7. Constructed protein-protein interaction of differentially downregulated proteins (DDPs) predicted using STRING software.
Nodes represent DDPs and edges the interactions between two proteins. The colour of the edge indicates the interaction score (edge score). Red nodes highlight DDPs functionally annotated in viral processes.

