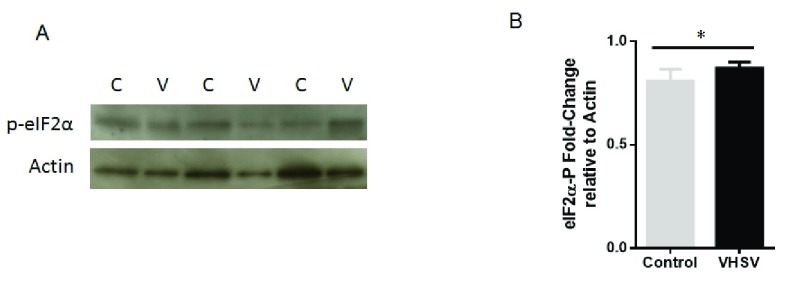
Figure 8. Phosphorylation of translation initiation factor eIF2α in VHSV-exposed rainbow trout RBCs.
( A) Representative western blot of eIF2α phosphorylation (eIF2α-P) in VHSV-exposed (V) (MOI 1, 14°C, 72 hpe) and control RBCs (C) (non-exposed). ( B) Bar plot of eIF2α-P protein content of stained bands estimated by densitometry, relative to α-Actin. Mann Whitney Test was performed for statistical analysis between VHSV-exposed cells and control cells. Asterisk denote statistically significant differences ( P-value < 0.05).

