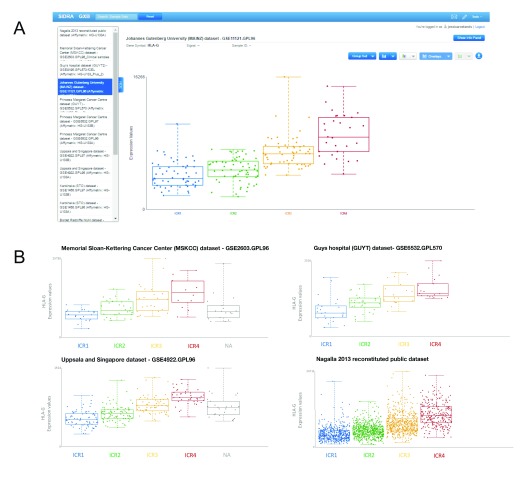
Figure 3. Illustrative example of abundance of HLA-G transcripts across ICR groups in multiple breast cancer datasets in GXB.
( A) Cross Project View in GXB showing HLA-G expression across ICR groups. ICR represents the immune gene signatures observed in association with tissue-specific destruction. In this view of GXB, expression of HLA-G can be visualized across projects listed on the left. ( B) Boxplots of HLA-G expression across ICR groups of three additional representative datasets selected from the dataset collection and the complete dataset including all annotated cases (right bottom plot). Plots indicate an increased HLA-G expression in breast tumors with a high expression of ICR genes. ICR, Immunologic Constant of Rejection.

