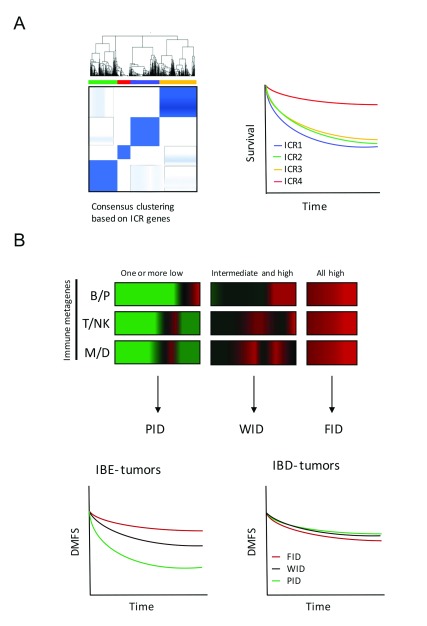
Figure 1. Basis of ICR and IDS/IBS classifications and prognostic value.
( A) Consensus clustering based on ICR genes segregates breast cancer patient in four different groups: ICR1, 2, 3 and 4. Patients with tumors categorized as ICR4 have the highest expression of the ICR gene signature and have a better prognosis compared with other ICR groups. ( B) Immune metagene model based on the relative expression of immune metagenes (B/P, T/NK and M/D) distinguishes PID, WID and FID tumors (horizontal axis: genes, vertical axis: individual cases). This classification has prognostic value in IBE tumors, and not in IBD tumors. Diagrams are based on Hendrickx et al., 2017 ( A) and Miller et al., 2016 ( B). This figure is for explanatory purposes only and does not serve as a demonstration of the GXB web application. ICR, Immunologic Constant of Rejection; IBE/D, Immune Benefit Enabled OR Disabled; F/P/WID, Favorable OR Poor OR Weak Immune Disposition.

