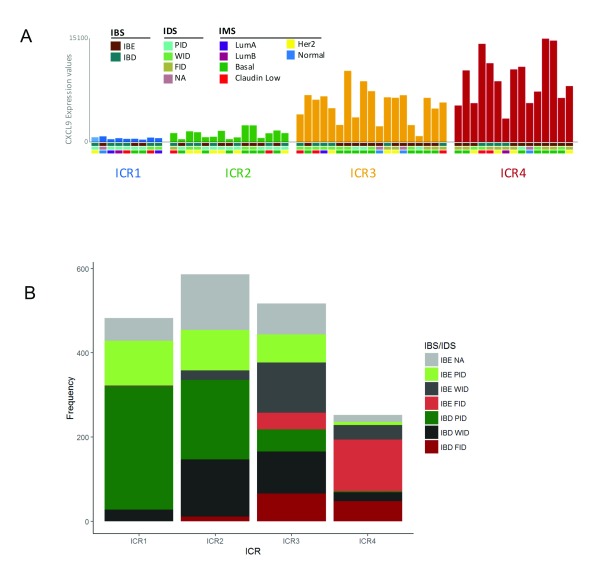
Figure 5. Overlay of immunologic classifications in breast cancer as evaluated in GXB.
( A) Bar graph showing CXCL9 expression in individual samples from Erasmus Medical Center (EMC) dataset 2 split by ICR (single bar represents single case). Overlay of additional variables IBS, IDS and IMS is shown ( http://breastcancer.gxbsidra.org/dm3/miniURL/view/Lv). ( B) Frequency plot showing number of breast cancer cases across IBS/IDS subgroups split by ICR cluster. ICR, Immunologic Constant of Rejection; IBE/D, Immune Benefit Enabled OR Disabled; F/P/WID, Favorable OR Poor OR Weak Immune Disposition.

