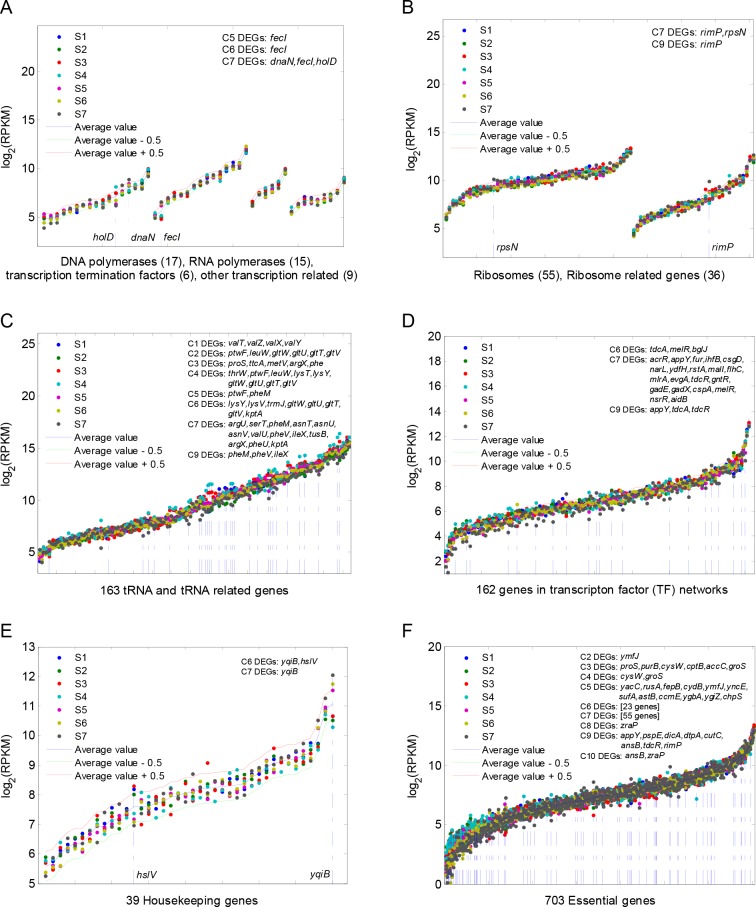
Figure 4.
Host gene expression profile comparison across all RNA-Seq samples. The blue curve represents the mean expression value of each gene in the seven samples. The red curve represents the upper bound of 1.44 times the mean expression value, whereas the green curve represents the lower bound of 1/1.44 times the mean value. Hence, if the gene expression value is significantly outside the region between the red and green curves, it is likely that the gene will be a candidate of differentially expressed genes. The gene expression profiles of DNA polymerases, RNA polymerases, transcriptional termination factors and other transcription related genes (A), ribosomes and related genes (B), tRNA and tRNA related genes (C), transcription factors (D), housekeeping genes (E) and essential genes (F) are shown, respectively. The differentially expressed genes resulted from each paired comparison are listed in the upper right-hand corner of each figure panel. In all panels, genes on the horizontal axis are ranked in ascending order by their mean values of gene expression (RPKM).

