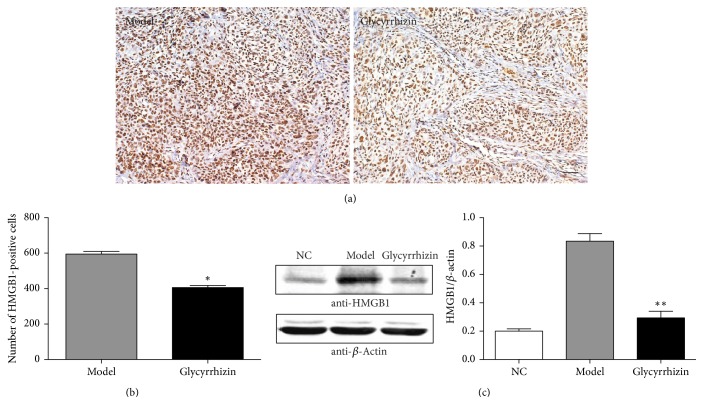
Figure 3.
The protein level of HMGB1 is suppressed by glycyrrhizin. (a) indicates the protein level of HMGB1 in lung tumor tissues from the two groups detected by IHC staining assay, bar = 100 μm. (b) indicates the quantitative results based on IHC staining assay. HMGB1-positive cells were counted in the two groups, respectively. ∗p < 0.05, as compared to the model control by t-test. (c) indicates the protein level of HMGB1 from the three groups by western blot. β-Actin was used as an internal control. p value was calculated by t-test between glycyrrhizin treatment and DMSO treatment (model). “NC” represents lung tissue from normal mice. ∗∗p < 0.01, as compared to the model control.

