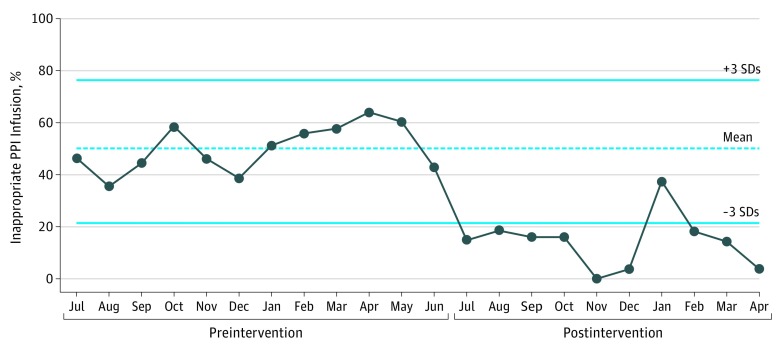
Figure. Rates of Inappropriate Proton Pump Infusion (PPI) Use Before and After Intervention for the 2-Year Study Period.
Statistical process control chart showing rates of inappropriate PPI use before and after the intervention. The mean, upper control limit (+3 SDs), and lower control limit (−3 SDs) were calculated based on preintervention data.

