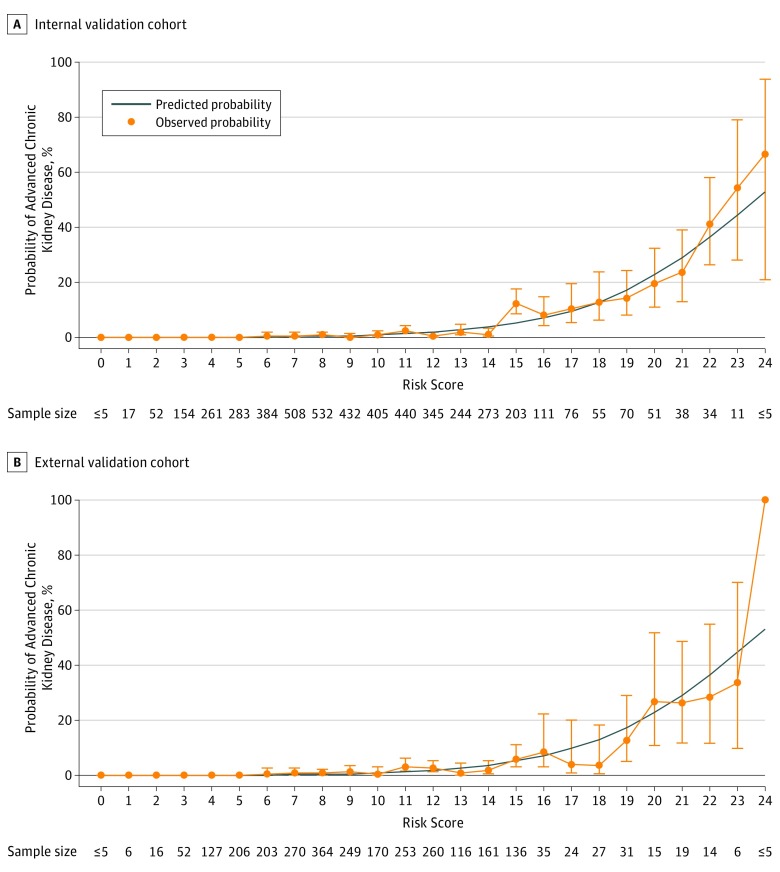
Figure 3. Predicted vs Observed Probability of Advanced Chronic Kidney Disease by the 6-Variable Risk index in the Internal Validation and External Validation Cohorts.
Internal validation cohort (n = 4956) and external validation cohort (n = 2761). Error bars indicate 95% confidence intervals. The risk scores observed in both cohorts ranged from a minimum value of 0 to maximum value of 24.

