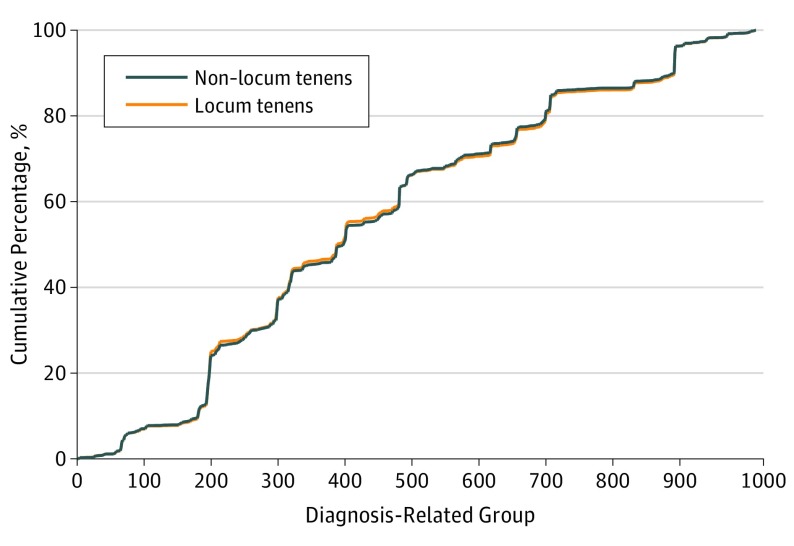
Figure 2. Cumulative Distributions of Admitting Diagnosis-Related Groups in 2009-2014.
Cumulative distributions of the admitting diagnosis-related groups (DRGs) for all hospitalized patients in the study sample, grouped by locum tenens (orange line) vs non–locum tenens (blue line) physicians. Although DRG numbers are categorical values representing separate diagnoses, we graphed the cumulative distribution on a continuous scale to visualize the composition of admissions diagnoses of hospitalized patients across hundreds of DRGs. Therefore, the overlap between the 2 distributions can reveal subtle differences in admissions diagnosis mix across these many diagnoses.

