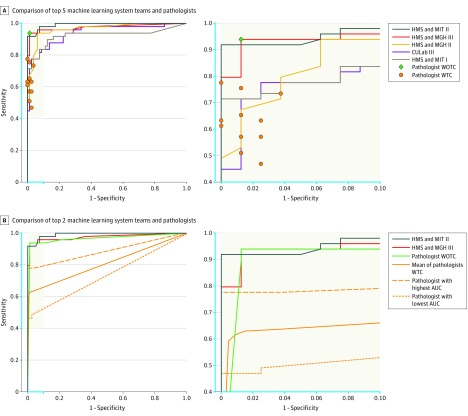
Figure 3. ROC Curves of the Top-Performing Algorithms vs Pathologists for Metastases Classification (Task 2) From the CAMELYON16 Competition.
AUC indicates area under the receiver operating characteristic curve; CAMELYON16, Cancer Metastases in Lymph Nodes Challenge 2016; CULab, Chinese University Lab; HMS, Harvard Medical School; MGH, Massachusetts General Hospital; MIT, Massachusetts Institute of Technology; WOTC, without time constraint; WTC, with time constraint; ROC, receiver operator characteristic. The blue in the axes on the left panels correspond with the blue on the axes in the right panels. Task 2 was measured on the 129 whole-slide images (for algorithms and the pathologist WTC) and corresponding glass slides (for 11 pathologists WOTC) in the test data set, which 49 contained metastatic regions. A, A machine-learning system achieves superior performance to a pathologist if the operating point of the pathologist lies below the ROC curve of the system. The top 2 deep learning–based systems outperform all the pathologists WTC in this study. All the pathologists WTC scored glass slide images using 5 levels of confidence: definitely normal, probably normal, equivocal, probably tumor, definitely tumor. To generate estimates of sensitivity and specificity for each pathologist, negative was defined as confidence levels of definitely normal and probably normal; all others as positive. B, The mean ROC curve was computed using the pooled mean technique. This mean is obtained by joining all the diagnoses of the pathologists WTC and computing the resulting ROC curve as if it were 1 person analyzing 11 × 129 = 1419 cases.

