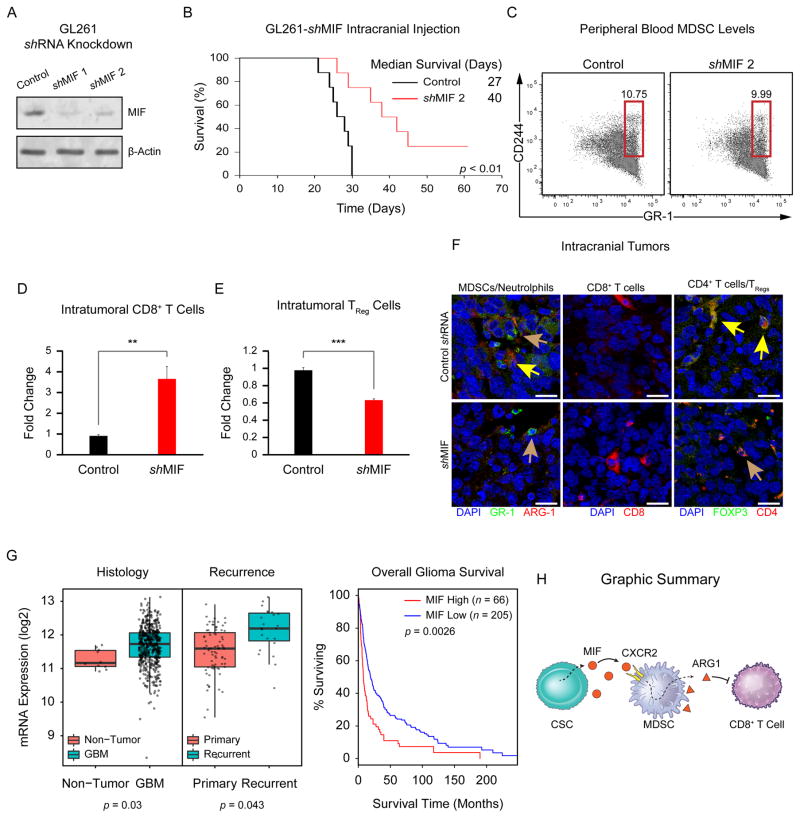
Figure 6.
MIF depletion attenuates tumor immune suppression and confers a survival advantage in vivo. Immunoblot for MIF after MIF shRNA treatment of GL261 cells (A). Survival of mice intracranially injected with control (black) or MIF KD (red) GL261 cells, p <.01 by log-rank test (B). Median survival is indicated. MDSCs in the peripheral blood of mice bearing control and MIF KD GL261 intracranial xenografts (C). Intratumoral CD8+ T cells (CD3+/CD8+), **, p <.01 by pairwise t-test (D) and TReg cells (CD3+/CD4+/CD25+/FOXP3+), ***, p <.001 by pairwise t-test (E) in MIF KD GL261-injected mice vs. controls. Immunofluorescence of intracranial mouse xenografts (F). (Left) Yellow arrows: MDSCs (GR-1+/ARG-1+); brown arrows: neutrophils (GR-1+/ARG-1−). (Right) Yellow arrows: TRegs (FOXP3+/CD4+); brown arrows: CD4+ activated T cells (FOXP3−/CD4+). Bioinformatics analysis of MIF mRNA expression levels in human GBM pathological specimens (G) compared with nonmalignant control tissues (Left Panel, p = .03 by pairwise t-test). MIF mRNA expression levels in primary versus recurrent human GBM (Central Panel, p = .043 by pairwise t-test). Kaplan–Meier analysis of MIF expression levels informs human GBM patient survival (Right Panel, p = .0026 by log-rank test). Cartoon summary of the CSC/MDSC/T Cell interaction that takes place in the GBM TME (H). Scale bar = 20 μm. Abbreviations: GBM, glioblastoma; MDSCs, myeloid-derived suppressor cells; MIF, migration inhibitory factor.

