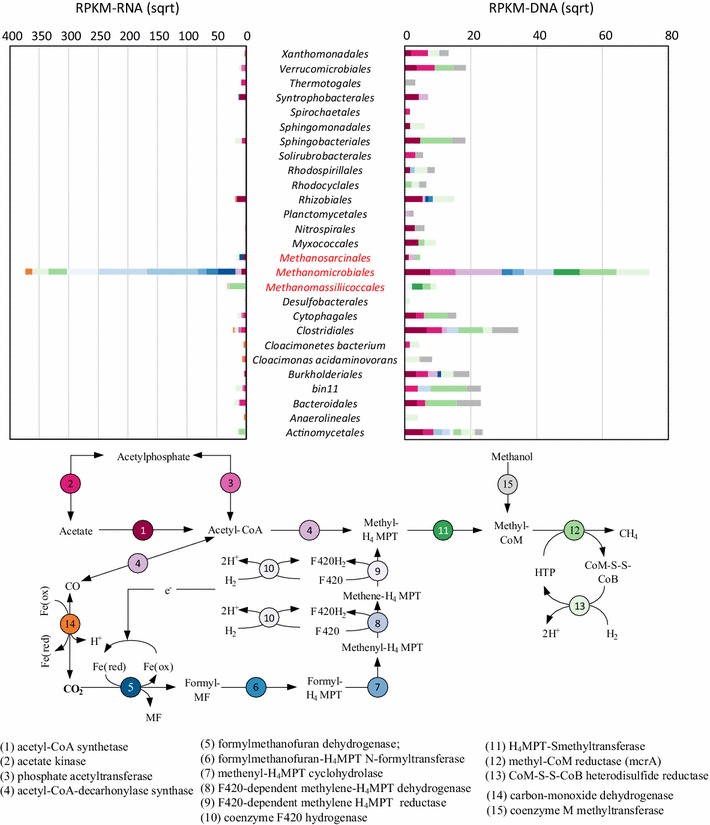
Fig. 4.

Transcriptional activities (right) and genomic prevalence (left) of genes in the methanogenesis pathway. Genes were classified into various phylogenetic orders, as shown in the top figure, and colored according to their functions in the methanogenesis process (as adopted from the KEGG Methane Metabolism pathway), as shown in the flowchart (bottom figure)
