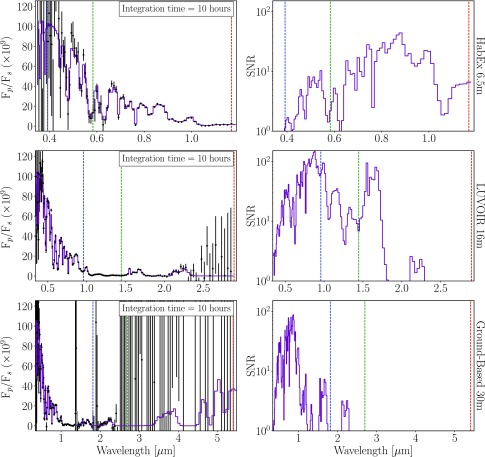
FIG. 21.
Simulated coronagraph spectrum (left column) and the SNR in each spectral element (right column) for the 10 bar O2-rich planet with an ocean surface using three different future telescope concepts: a 6.5 m HabEx (top row), a 16 m LUVOIR (middle row), and a 30 m ground-based telescope (bottom row). The simulated observations, showing 1σ errors, and the SNR calculations assume an integration time of 10 h per nulling bandwidth. Dashed vertical lines are placed at IWA = 1λ/D (red), 2λ/D (green), and 3λ/D (blue) to show the long-wavelength limit for the given telescope diameter and planet-star angular separation. All spectra are shown for a spectral resolution of R = 70.

