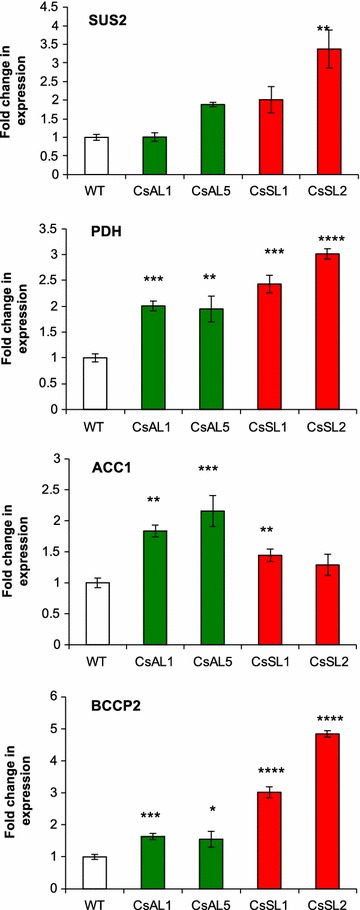
Fig. 9.

Analysis of SUS2, PDH E1α, BCCP2, and ACC1 expression using quantitative reverse transcription-PCR on developing seeds of Camelina transgenic lines. Wild-type and transgenic plants are designated as explained in legend to Fig. 3. Significant differences compared to wild type (Student’s t test) are indicated: **P < 0.01, ***P < 0.001 and ****P < 0.0001. Error bars indicate standard deviation, n = 6
