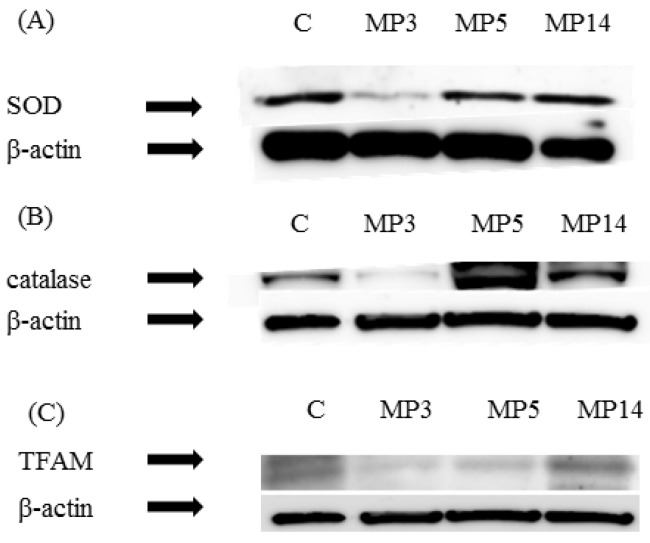
Figure 3.
Western blot study (A) SOD, (B) catalase (C) TFAM. Serial changes of SOD, catalase, and TFAM in the femur as a control, β-actin is shown in the respective lower panels. In MP3 group as compared with C group expression was significantly decreased (A,B). In MP3 group and MP5 group as compared with C group expression was significantly decreased, while in MP14 group expression was improved (C).

