Figure 1.
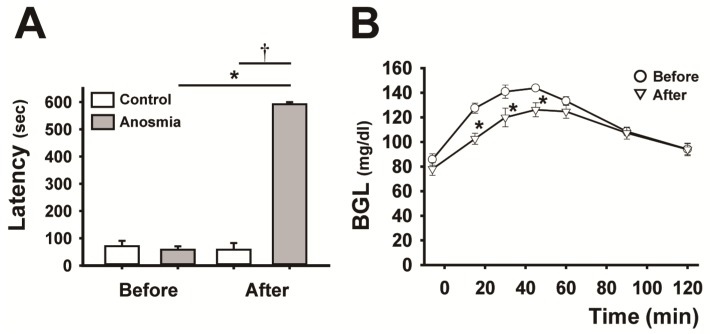
Effect of anosmic treatment on the blood glucose curve. A, comparison of the latency to the finding of the cookie before and after the anosmic treatment in the control and anosmic groups. Data are mean ± SEM (n=6, per each group), *P < 0.05 (after vs. before anosmic treatment), Wilcoxon signed-rank test, †P < 0.01 (anosmic groups vs. control groups after the anosmic procedure), Mann-Whitney U test. B, the BG curves before and after anosmic treatment in anosmic rats. Data are mean ± SEM (n=6), *P < 0.05 (after vs. before anosmic treatment), two-way repeated-measures ANOVA followed by Tukey-kramer test.

