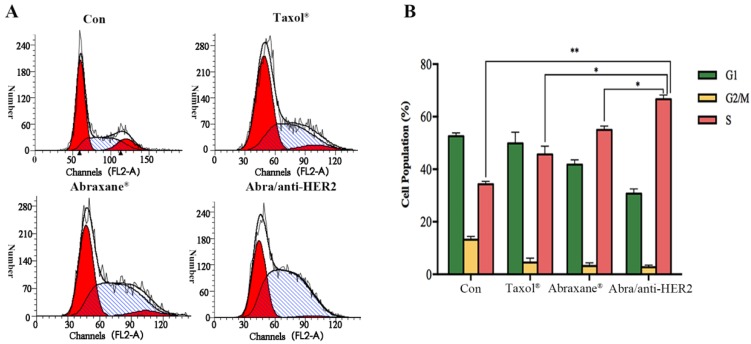
Figure 3.
Cell cycle distributions of SK-BR-3 cells treated with different agents SK-BR-3 cells were treated with 0.02 ng/mL PTX equivalent at 37 ℃ for 48h. Samples were analysed by flow cytometry (A). Results are expressed as the percentage of each subpopulation (B) as determined by analysis of 5,000 cells per sample (*: P< 0.05, **: P<0.01)

