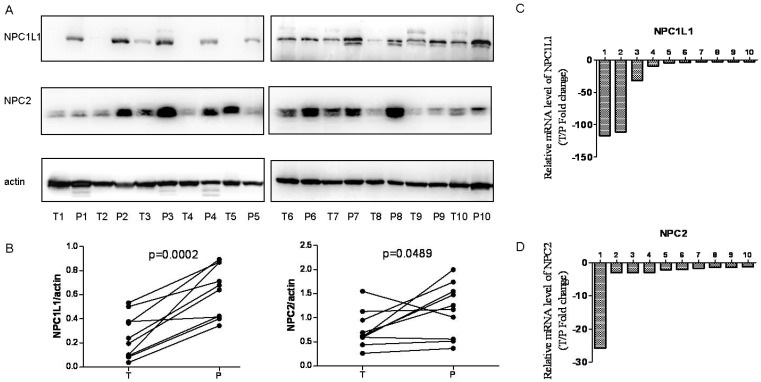
Figure 2.
NPC1L1 and NPC2 expression in peritumoral tissue and paired HCC tissues by Wetern-blot and Real-time Quantitative PCR. (A) NPC1L1 and NPC2 expression was detected by Western blot analyses in 10 paired HCC tissue (T) and peritumoral tissue (P). (B) Quantitation of proteins from Western blot analyses shows that both NPC1L1 and NPC2 expressions significantly reduced in HCC tissue (T) (p=0.0002 for NPC1L1, p=0.0489 for NPC2). The mRNA expression of NPC1L1 and NPC2 was detected by Real-time Quantitative PCR. Results clearly shows that mRNA expression levels also reduced in HCC tissue (T) compared to peritumoral tissue (P) for both NPC1L1 (C) and NPC2 (D).

