FIG 4.
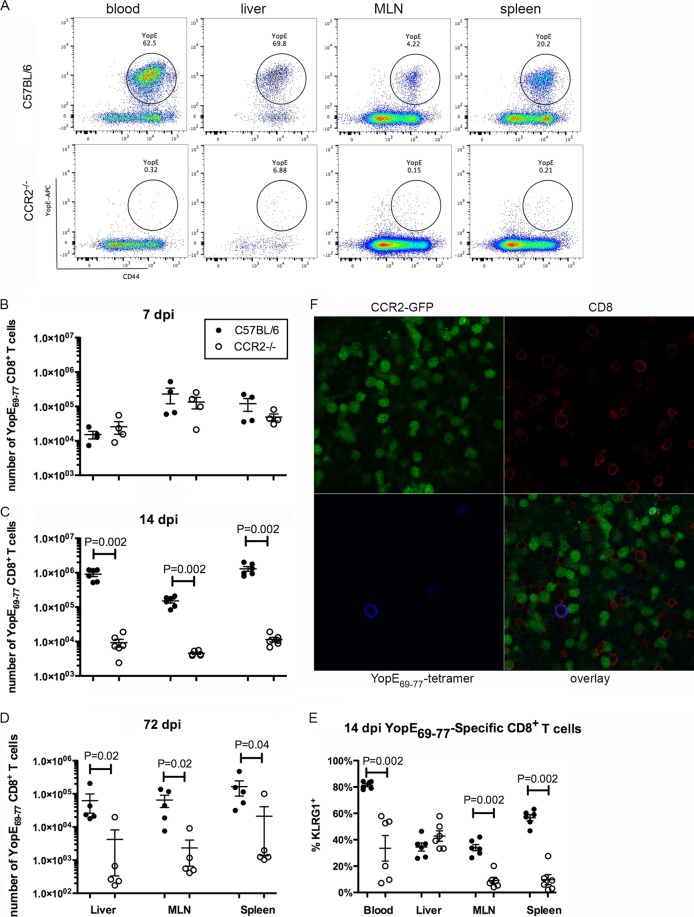
CCR2 is required for formation of large numbers of YopE69–77-specific CD8 T cells. Mice were infected orally with 5 × 10⁷ CFU of 32777, as described in the legend to Fig. 2. (A to E) Cells from the indicated tissues were subjected to flow cytometry following staining with the tetramer and a panel of antibodies. (A) Representative dot plots of YopE69–77 tetramer and CD44 signals of gated CD45.2+ CD3+ CD8+ T cells from the indicated tissues at 14 dpi. (B to D) Numbers of YopE69–77-specific CD8+ T cells at 7 dpi (B), 14 dpi (C), or 72 dpi (D) are plotted. The numbers of YopE69–77-specific CD8+ T cells in uninfected C57BL/6 and CCR2−/− mice were 0.73 × 10⁴ ± 0.43 × 10⁴ and 1.6 × 10⁴ ± 0.60 × 10⁴ (liver), 0.37 × 10⁴ ± 0.27 × 10⁴ and 0.33 × 10⁴ ± 0.18 × 10⁴ (MLN), and 0.81 × 10⁴ ± 0.30 × 10⁴ and 1.74 × 10⁴ ± 0.98 × 10⁴ (spleen), respectively. (E) Percentages of tetramer-positive CD8+ cells that are also positive for the effector marker KLRG1 at 14 dpi. Data shown are the summaries of results from two or more independent experiments, with means and standard errors indicated. P values were determined with the Mann-Whitney test, and P values of <0.05 are indicated. (F) Fresh thick sections of MLN were prepared from an infected CCR2-GFP mouse at 7 dpi and stained with the YopE69–77 tetramer conjugated with APC and CD8α antibodies as described in Materials and Methods. Representative confocal microscopy images of indicated individual and overlaid fluorescent signals are shown.

