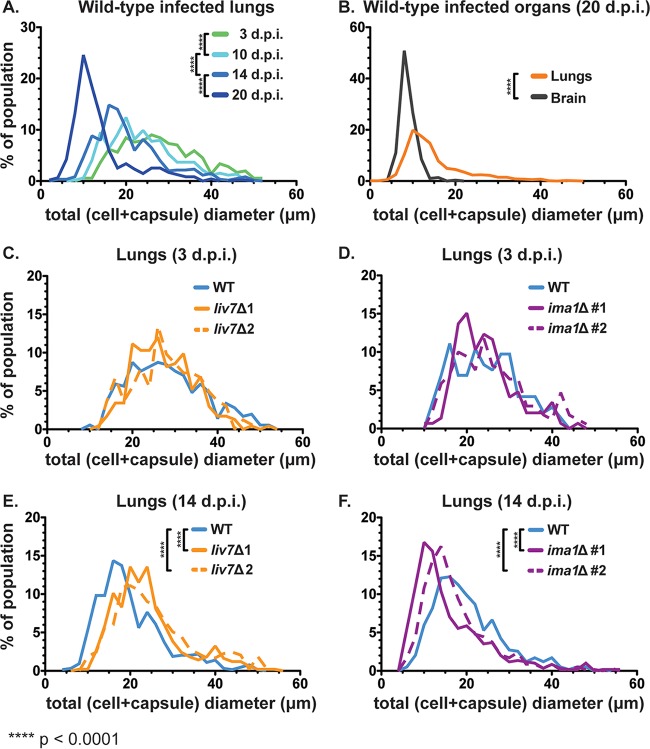
FIG 6.
Cell size distributions over the course of infection. We visualized fungal cells from tissue homogenates (from infected mice used in the experiments represented in Fig. 5B to E) in india ink and measured cell size. Total diameter was measured as shown in Fig. 1A. (A) Mean total cell diameter decreases over time within the lungs of wild-type-infected mice as the population shifts toward smaller cells with smaller capsules (n = 3 to 4 mice per time point, ≥120 cells per mouse). (B) Disseminated cells found in the brain late in infection (20 dpi) overlap the size profile of smaller cells found in the lungs at the same time point. (C and D) Early after inoculation (3 dpi) the distributions of both liv7Δ mutant 1/2 and ima1Δ mutant 1/2 cells match the distribution of wild-type cells in the lungs (n = 3 mice, ≥50 cells per mouse). (E and F) At an early point in dissemination (14 dpi), liv7Δ mutant 1/2 cell populations were of larger average total cell diameter than wild-type C. neoformans cells in the lungs. ima1Δ mutant 1/2 cells were of smaller average total cell diameter than wild-type C. neoformans cells (n = 4 mice, ≥120 cells per mouse). P values were calculated using a Mann-Whitney test. Frequency bin size, 2.0 μm.

