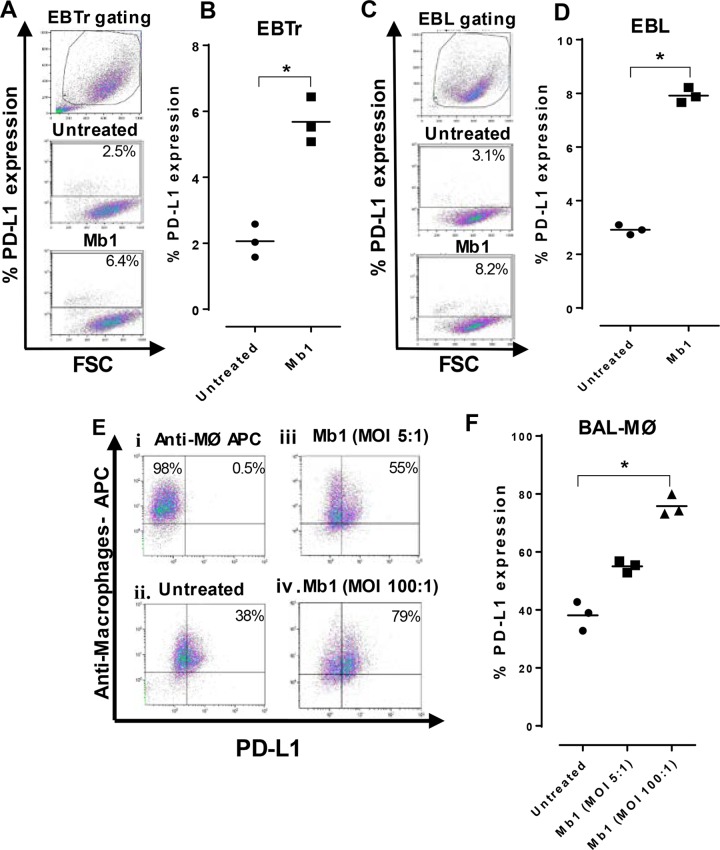
FIG 1.
PD-L1 expression on EBTr and EBL cell lines and BAL-Mϕ is increased after M. bovis infection. PD-L1 expression on different cells was tested after 18 h of incubation with or without M. bovis infection at different MOIs. (A, C, and E) FCM gating on EBTr cells (A), EBL cells (C), and BAL-Mϕ (E) showing different conditions, including untreated and Mb1 treated cells. (B, D, and F) Graphs showing percentages of PD-L1 expression on EBTr cells (B), EBL cells (D), and BAL-Mϕ (F). There was a significant increase in PD-L1 expression after Mb1 infection at an MOI of 100:1. Three technical replicates were always performed under every condition in each experiment, and the graphs indicate the medians and ranges of representative data from one of three independent experiments. Panel F shows representative data for BAL-Mϕ collected from 3 cattle separately in three independent experiments. *, P < 0.05 for significant differences in PD-L1 expression on Mb1-infected cells versus untreated cells. APC, allophycocyanin.

