
FIG 1.
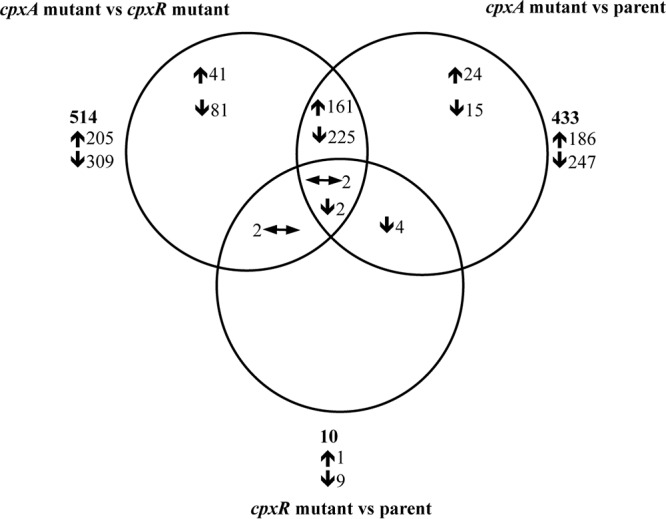
Venn diagram showing the number of genes differentially expressed in the cpxA mutant versus the cpxR mutant, the cpxA mutant versus the parent, and the cpxR mutant versus the parent. The up- and downregulated genes or operons are indicated by up (↑) and down (↓) arrows, respectively; genes that are differentially regulated in opposite directions in two or more strains are indicated by sideways arrows (↔). The total numbers of genes differentially expressed are shown in bold outside the Venn diagram.