FIG 5.
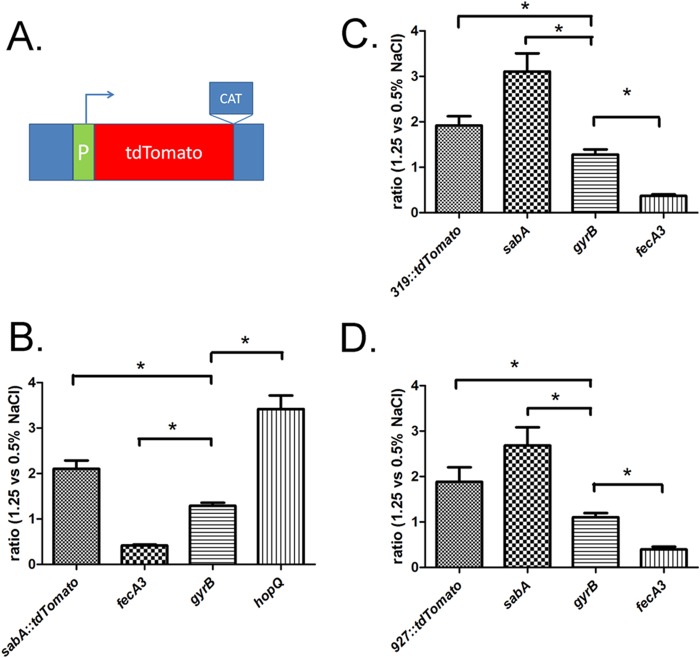
Experiments with transcriptional reporters show that transcription of sabA and hopQ is upregulated in response to high-salt conditions. (A) Schematic representation of the key components of the transcriptional reporters. Each of the transcriptional fusion constructs contains a DNA sequence (including the promoter [P] and 5′-untranslated region [UTR]) upstream of the translational start site of the gene of interest fused to the tdTomato ORF. Immediately downstream of the ORF is an antibiotic selection marker (chloramphenicol acetyltransferase [CAT]) that confers resistance to chloramphenicol. The sabA reporter is designated sabA::tdTomato, and the hopQ reporters (for HPB8_319 and HPB8_927) are designated 319::tdTomato and 927::tdTomato, respectively. These transcriptional fusion constructs were introduced into the H. pylori chromosome as described in Materials and Methods. The introduction of each specific gene::tdTomato reporter resulted in deletion of the corresponding ORF (sabA or one of the copies of hopQ). Each H. pylori reporter strain was cultured for 6 h in BB-FBS-0.5% or BB-FBS-1.25% medium. RNA was isolated and transcript levels were quantified as described in Materials and Methods. All transcript data were normalized to 16S rRNA, and the normalized data then were analyzed to compare gene expression in H. pylori cultures grown in BB-FBS-0.5% or BB-FBS-1.25% medium. (B to D) Salt-responsive changes in strains harboring the sabA::tdTomato (B), 319::tdTomato (C), or 927::tdTomato (D) transcriptional reporters are shown. In experiments with the sabA::tdTomato reporter strain, transcript levels of fecA3, gyrB, and hopQ were monitored in parallel. In experiments with the hopQ 319::tdTomato and 927::tdTomato reporter strains, the expression of sabA, gyrB, and fecA3 was similarly monitored. Each panel depicts results from five independent experiments using RNA derived from H. pylori cultures grown in BB-FBS-0.5% (n = 5) or BB-FBS-1.25% (n = 5) medium. The mean and standard error of the mean are reported. Significant differences (P < 0.05, Student's t test) in expression between the indicated samples are indicated by an asterisk.

