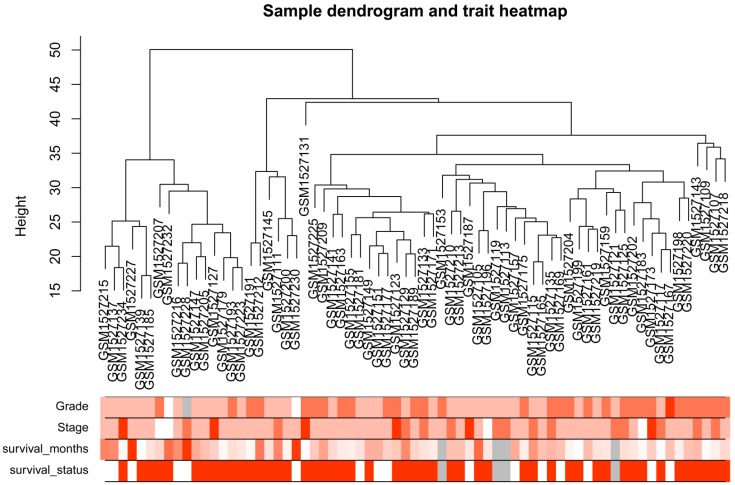
Figure 2.
Samples clustering to detect outliers (GSE62452): sample dendrogram and trait indicator. The clustering was based on the expression data of differentially expressed genes between tumor samples and non-tumor samples in PDAC (only the tumor samples, n = 69). The color intensity was proportional to older age, higher histological grade and pathological stage, longer survival month. In survival status, white means patient alive and red means patient dead.

