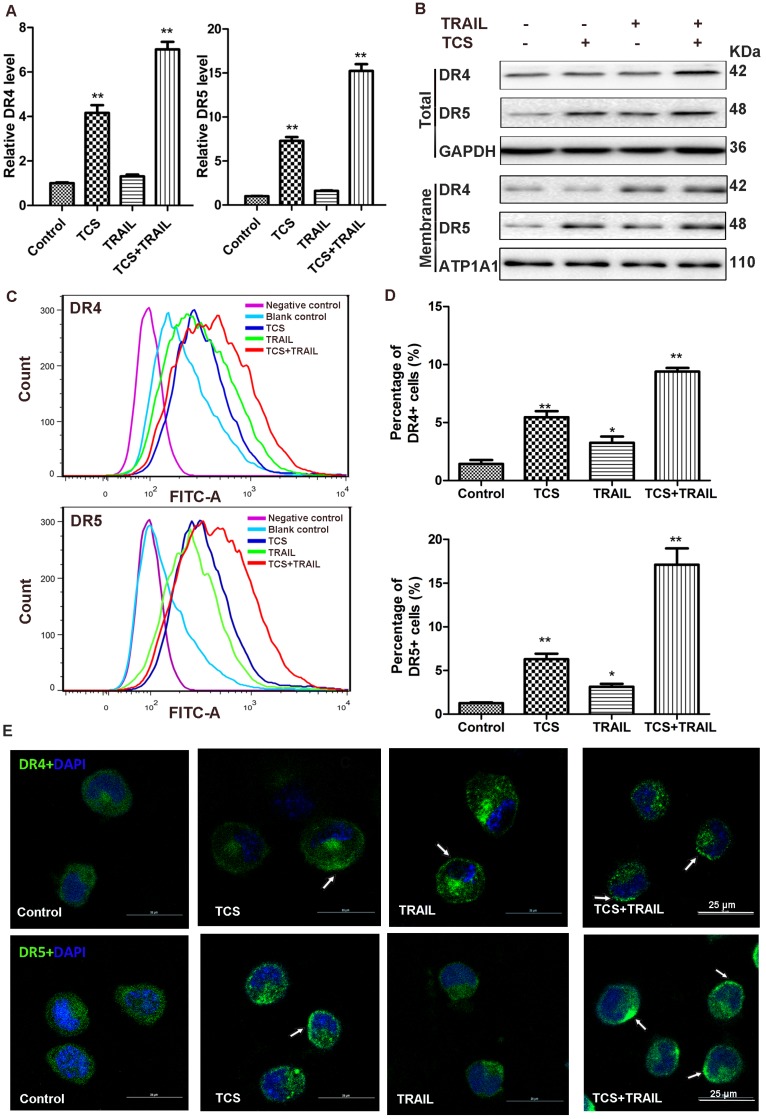
Figure 4.
The combination of TCS and TRAIL upregulated the expression and cell surface accumulation of DR4 and DR5. (A) The transcriptional levels of DR4 and DR5 (relative to GAPDH) were analyzed by qRT-PCR in H1299 cells treated with 50 ng/ml TRAIL or / and 40 μg/ml TCS for 48 h. All assays were performed in triplicates and repeated 3 times. *, p < 0.05; **, p < 0.01. (B) The protein levels of DR4 and DR5 were analyzed by Western blot. GAPDH and ATP1A1 were used as internal controls to verify equal protein loading. (C) The cell surface levels of DR4 and DR5 were detected by indirect immunofluorescence staining using Flow cytometry. (D) A graphical representation of the data from 3 independent experiments. *, p < 0.05; **, p < 0.01. (E) The accumulation of DR4 and DR5 on the surface of the cell membrane was revealed by confocal microscopy, marked by white arrow. The magnification was 800X. The scale bar: 25 μm.

