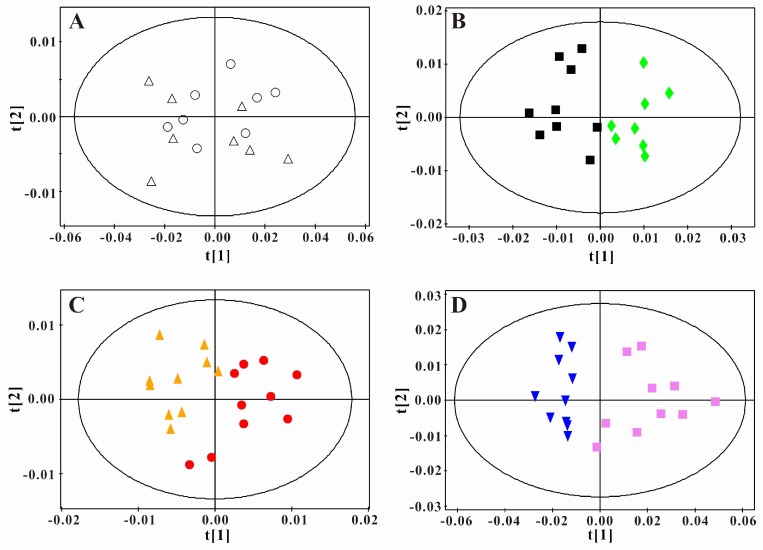
Figure 5.
Principal component analysis of serum 1H NMR spectra data for LDLR-/-,PSGL-1+/+ and LDLR-/-,PSGL-1-/- mice. Scores plots of PCA for LDLR-/-,PSGL-1+/+ and LDLR-/-, PSGL-1-/- mice at 8w (A, R2 =0.886, Q2 =0.828) , 8+8w (B, R2 =0.908, Q2 =0.793), 8+12w (C, R2 =0.774, Q2 =0.482), 8+16w (D, R2 =0.948, Q2 =0.907). LDLR-/-,PSGL-1+/+ mice at 8w (○), 8+8w (■), 8+12w (●) and 8+16w (▼); LDLR-/-,PSGL-1-/- mice at 8w (△), 8+8w (◆), 8+12w (▲) and 8+16w (■).

