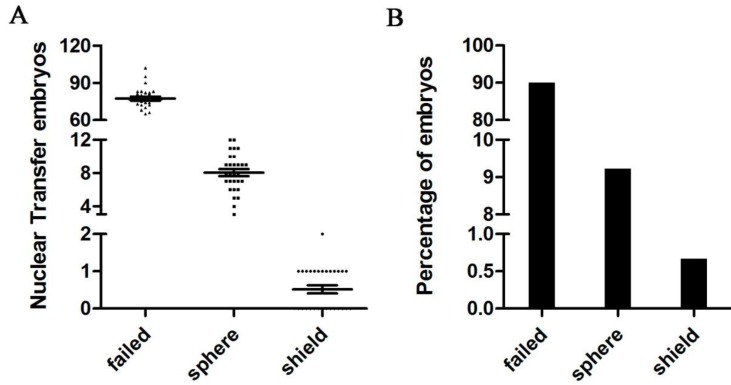
Figure 6.
Developmental profiles of nuclear transplants at different stages. A: The average number of different batches of kidney cell nuclear transfer embryos. N(failed) = 77.34 ± 5.65, N(sphere) = 8.03 ± 1.83, N(shield) = 0.52 ± 0.54. B: Percentage of kidney cell nuclear transfer embryos at different stages. SCNT embryos failed to cleave. SCNT embryos arrested at the sphere stage. SCNT embryos successfully developed at the shield stage.

