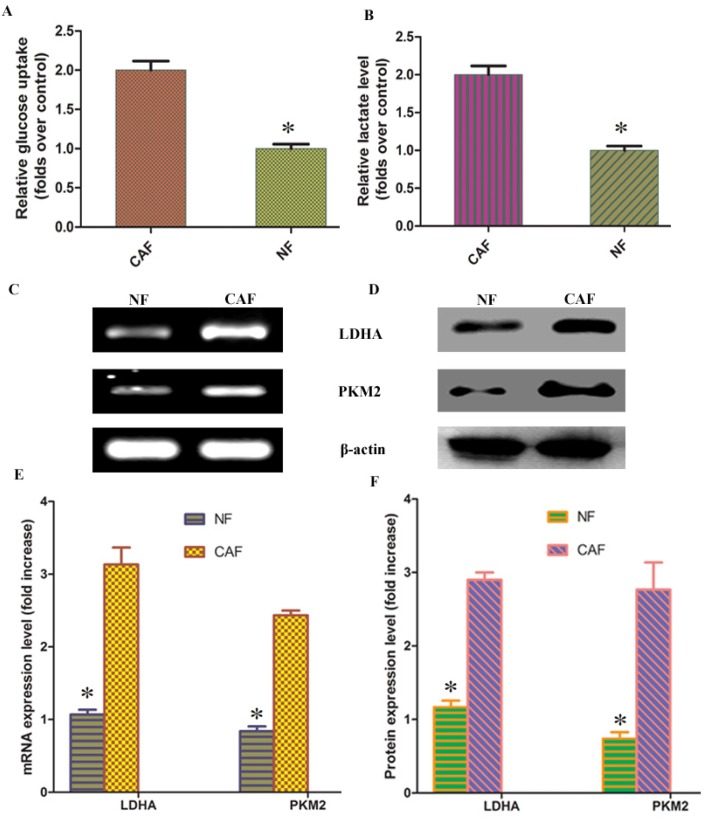
Figure 2.
CAF glycolytic metabolism. A, B: Glucose uptake and lactate production were significantly increased in CAFs compared to NFs. C, D: PCR and Western blotting results showed that LDHA and PKM2 mRNA and protein were highly expressed in CAFs. E, F: Results of statistical analysis. The results relative to control cells are presented as a standard ratio. *indicates P < 0.05 by t-test.

