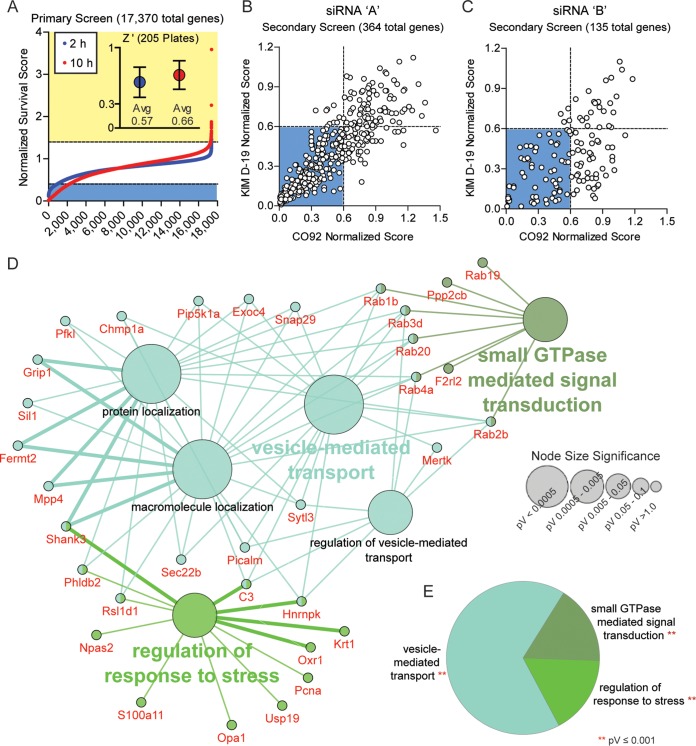
FIG 2 .
Identification of host factors required for intracellular survival of Y. pestis. RAW264.7 macrophages were reverse transfected with siRNAs for 48 h. (A) Transfected cells were infected with Y. pestis CO92 pCD1(-) LuxPtolC (MOI of 10), and intracellular bacterial bioluminescence (in RLU) was determined at 2 and 10 h postinfection. RLU values were normalized to the values for the controls and ranked from lowest to highest. Normalized scores of ≤0.4 are indicated by light blue shading, and normalized scores of ≥1.4 are indicated by yellow shading. (Inset) Average Z factor (Z′) ± standard deviation (SD) for all 205 screened plates. (B and C) For secondary validation, cells transfected with siRNA “A” (B) or siRNA “B” (C) were infected with Y. pestis CO92 pCD1(-) LuxPtolC or KIMD19 pCD1(+) LuxPtolC (MOI of 10), and intracellular bacterial bioluminescence (in RLU) was determined at 10 h postinfection. RLU values for each strain were normalized to the values for the controls and compared. Normalized scores of ≤0.6 are indicated by blue shading. (D) Cytoscape-generated layout for Gene Ontology (GO) term node clusters, with significant genes per cluster highlighted in red. Clusters are color coded by parent ontology, and subgroup ontology is labeled in black. Lines represent interconnections between detailed terms. Node size denotes significance. (E) Pie chart representing the percent parent ontology represented as a whole within validated genes. pV, P value.

