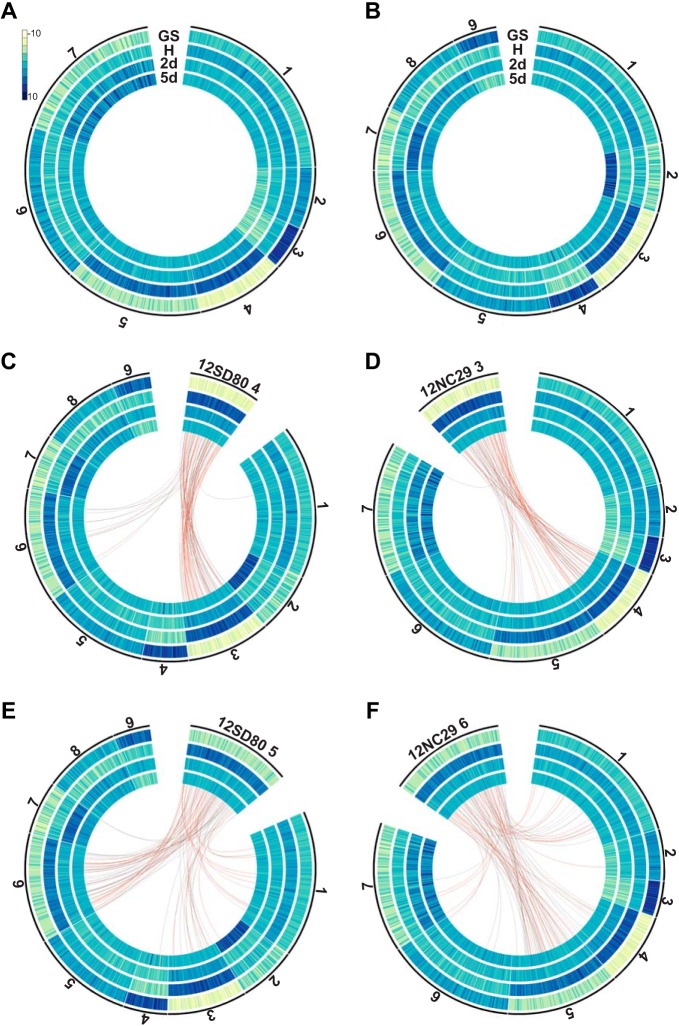
FIG 4 .
Clustering analysis of predicted secretome gene expression profiles and orthology in P. coronata f. sp. avenae. k-Means clustering of secretome genes of 12SD80 (A) and 12NC29 (B). Heatmaps show rlog-transformed expression values, with dark blue indicating high expression according to the scale. Cluster numbers are shown outside the graphs, and tracks show gene expression in germinated spores (GS), isolated haustoria (H), and infected tissues at 2 dpi (2d) and 5 dpi (5d). (C) Orthology relationships between genes in 12SD80 cluster 4 and all 12NC29 clusters are indicated by red (predicted effectors) and gray (other secreted proteins) lines. (D to F) Orthology relationships between genes in 12NC29 cluster 3 and all 12SD80 clusters (D), 12SD80 cluster 5 and all 12NC29 clusters (E), and 12NC29 cluster 6 and all 12SD80 clusters (F).

