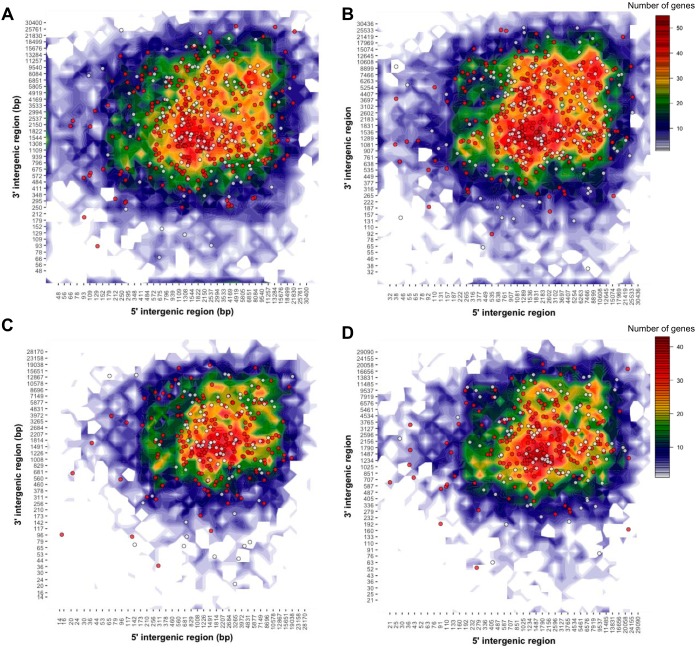
FIG 5 .
Genomic landscape of predicted P. coronata f. sp. avenae effectors. Heatmap plots representing the distribution of 5′ and 3′ intergenic distances for all genes on primary contigs of 12SD80 (A) and 12NC29 (B) and haplotigs of 12SD80 (C) and 12NC29 (D). Scales representing gene content per bin are shown on the right. Circles indicate predicted effectors with orthologs (red) or isolate singletons (white).

