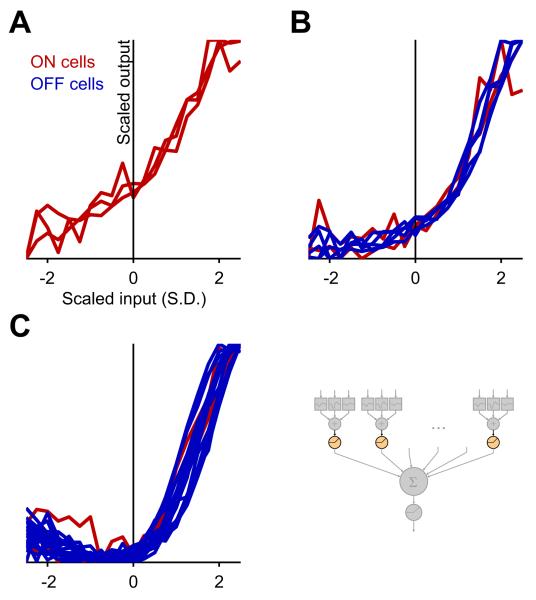
Figure 4. The LNSN model predicts a diversity of transfer functions at the bipolar cell synapse.
The internal nonlinearity of the BCM module inferred by the LNSN circuit model for different ganglion cells. The horizontal axis measures the input to that nonlinearity in units of its standard deviations (S.D.); the vertical axis shows the output of the functions. The nonlinearities are classified into three types: linear (A), monotonic nonlinear (B), and U-shaped (C). The BCM outputs are much more rectified for OFF GCs (blue) than for ON GCs (red; p = 0.005, χ2-test). See also Figure S5C.

