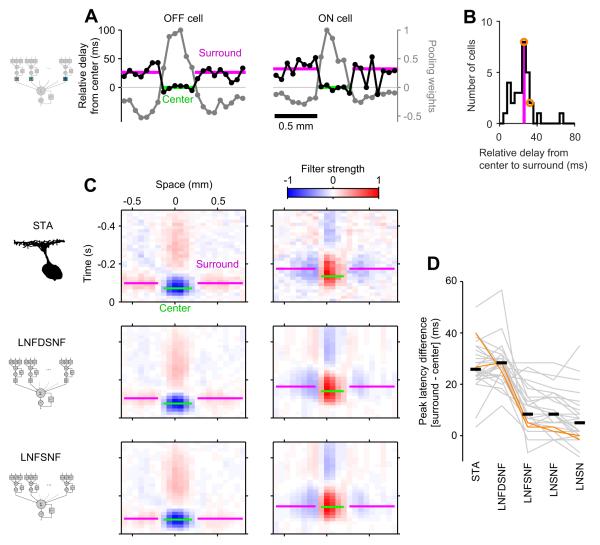
Figure 6. LNFDSNF: Time delays from amacrine cell processing explain the spatio-temporal receptive fields of ganglion cells.
(A) Delay functions (black; relative to the center) and the pooling functions (gray) for two representative cells (left, OFF type; right, ON type). The delays are longer in the surround (magenta; weighted average by the pooling weights) than in the center (green), and the transition occurs at the same spatial location where the pooling function crosses zero.
(B) Population data histogram of the relative delays from the center to the surround (median value in magenta; p < 0.001, sign test). The cells in A are highlighted in orange.
(C) Receptive fields (same cells as in A) calculated from the data (STA, top) show the surround (magenta, peak latency) lagging behind the center (green). Receptive fields calculated from the LNFDSNF model reproduce this feature (middle) but those from the LNFSNF do not (bottom).
(D) The difference in the peak latency between the center and the surround across different models. Each gray line indicates a cell, and the cells in c are highlighted in orange. The black horizontal bars show the median values, with significant differences between the STA and those models without delays (LNSN, LNSNF, and LNFSNF models; all with p < 0.001, rank sum test). The difference in the relative delay between the STA and the LNFDSNF model is not significant (p > 0.9).

