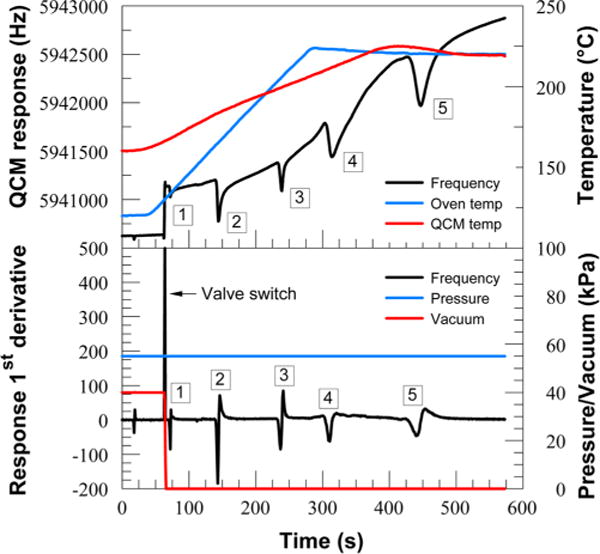
Figure 6.

Top: chromatographic separation of (1) methamphetamine, (2) MDMA, (3) PCP, (4) cocaine, and (5) THC (4 μg each). Oven and QCM detector profile are shown on the secondary axis. Bottom: 1st derivative of the frequency response with vacuum and pressure profile on the secondary axis.
