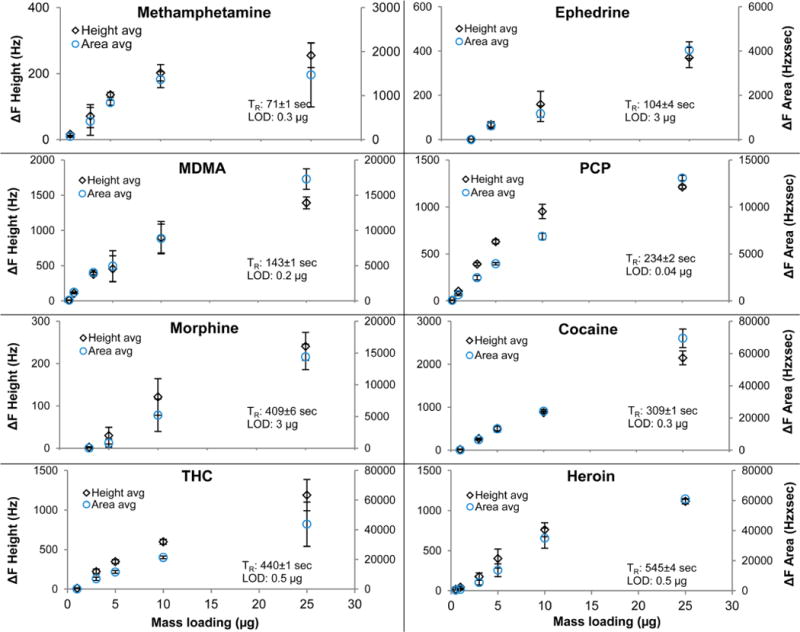
Figure 7.

Sensitivity plots of controlled substance standards measured with a column ramp profile from 120 to 210 °C at 15 °C/min and 55 kPa pressure. The detector temperature was ramped from 160 to 220 °C at 10 °C/min. An aliquot of the solution was directly deposited onto the sample swab. Height frequency change is plotted on the primary ordinate, the area frequency change on the secondary ordinate.
