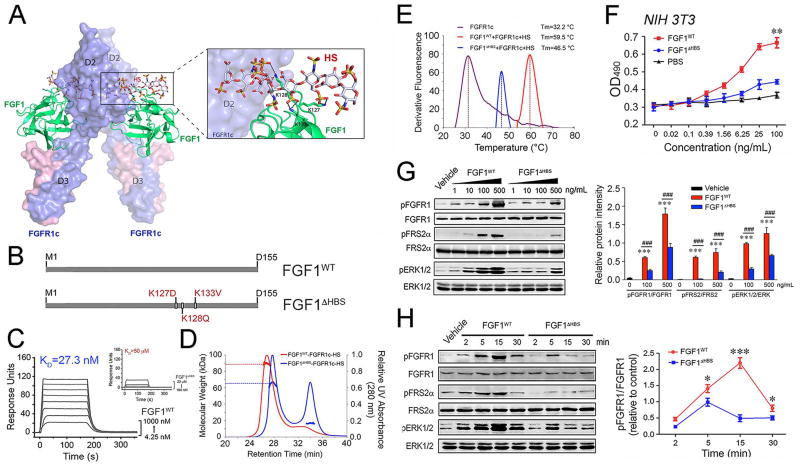
Figure 3. The differences in the stabilization of 2:2 FGF-FGFR dimers and the cellular response induced by wild-type FGF1 and FGF1ΔHBS.
(A) Cartoon representation of the crystal structure of the FGF1-FGFR1c complex (PDB ID: 1EVT) (Plotnikov et al., 2000) with a modeled HS oligosaccharide (shown as sticks) based on the crystal structure of the FGF2-FGFR1c-HS complex (PDB ID: 1FQ9) (Schlessinger et al., 2000). FGF1 and FGFR1c are colored green and light blue, respectively, and the HS oligosaccharide is colored gray. The side chains of the three lysine residues of FGF1 that are predicted to make major contacts with HS are shown as sticks, and black dashed lines denote hydrogen bonds. (B) Schematic illustration of the designation of the FGF1 variant, termed FGF1ΔHBS. (C) Overlay of SPR sensor grams illustrating binding of FGF1WT (left panel) and FGF1ΔHBS (right panel) to heparin. Heparin was coupled to an SPR biosensor chip and increasing concentrations of FGF1WT or FGF1ΔHBS were passed over the chip. (D) SEC-MALS analysis of FGFR1c ectodomain dimerization by FGF1WT or FGF1ΔHBS in the presence of HS dodecasaccharide. FGF1WT or FGF1ΔHBS (MW=17.4 kDa) was mixed with the FGFR1c ligand-binding domain (MW=25.4 kDa) and HS dodecasaccharide (MW=3 kDa) at a molar ratio of 1:1:1, and the mixtures were injected into a Superdex™ 200 10/300 gel filtration column and eluted with phosphate-buffered saline buffer (pH7.4). The elution profile of a mixture of FGF1WT with the FGFR1c ligand-binding domain alone served as a control. The 280 nm UV absorbance traces for the FGF1WT-FGFR1c-HS and FGF1ΔHBS-FGFR1c-HS complexes are colored blue, red and green, respectively. A second line below each protein complex peak denotes the peak area selected for molecular weight calculation. (E) Thermal stability of FGF1WT-FGFR1c-HS (red curve) and FGF1ΔHBS-FGFR1c-HS (blue curve) complexes by measuring their unfolding temperatures (Tm) using a fluorescence dye-based thermal shift assay. (F) Dose-response for NIH 3T3 fibroblast proliferation to FGF1WT and FGF1ΔHBS, respectively. Data from three independent measurements are presented as mean +/− SEM. **p<0.01 vs PBS buffer control. (G) Immunoblots showing dose-dependent activation of FGFR1, FGFR substrate 2α (FRS2α), and MAPK pathway (ERK1/2) by FGF1WT and FGF1ΔHBS in NIH 3T3 fibroblasts. Right panel: Quantification of Western blot by densitometric analysis. Data from three independent measurements are presented as mean +/− SEM. ***p<0.001 vs vehicle control; ###p<0.001 vs FGF1WT. (H) Immunoblots showing time-dependent activation of FGFR, FGFR substrate 2α (FRS2α), and MAPK pathway (ERK1/2) by FGF1WT and FGF1ΔHBS (100 ng/mL) in NIH 3T3 fibroblasts. Right panel: Quantification of Western blot by densitometric analysis. Data from three independent measurements are presented as mean +/− SEM. ***p<0.05, ***p<0.001 vs FGF1ΔHBS. See also Figure S3.

