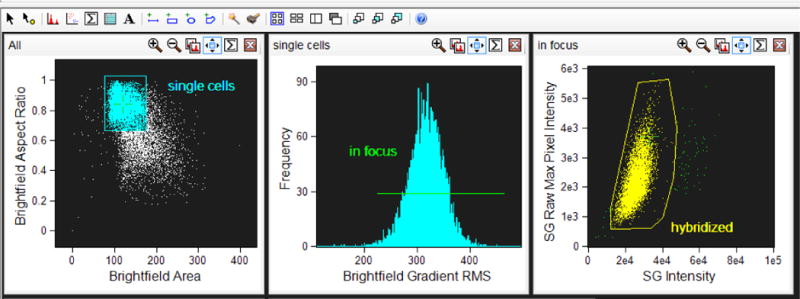
Figure 3. Hierarchical gating strategy to select cells of interest.

Single events are gated using Area of the Brightfield image (either in channel 1 or channel 9) versus Aspect Ratio of the brightfield image (aspect ratio close to 1 represents a single cell). Cells in focus are gated using Gradient Root Mean Squared of the Brightfield image. Positively hybridized cells are gated using Intensity of the SpectrumGreen signal verus Raw Max Pixel of the SpectrumGreen signal (Raw Max Pixel is a measure of the brightest pixel in the event). Very bright event to the right of the scatterplot are not included since, upon visual inspection, they represent doublet events that were insufficiently eliminated by the initial single cell gate.
