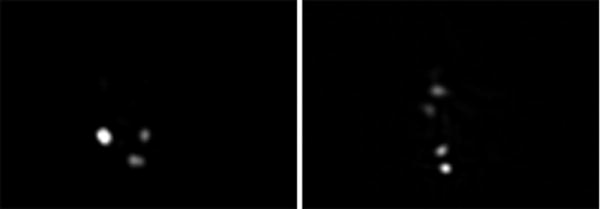
Figure 6. Segregated hybridization signal.

The images show CEP8 SpectrumGreen probe from a healthy donor where all events should contain two spots. Three spots (left image) or four spots (right image) can be observed but the intensity and proximity of the spots indicate that segregated hybridization has occurred. These examples would be classified as a disomy by conventional FISH.
