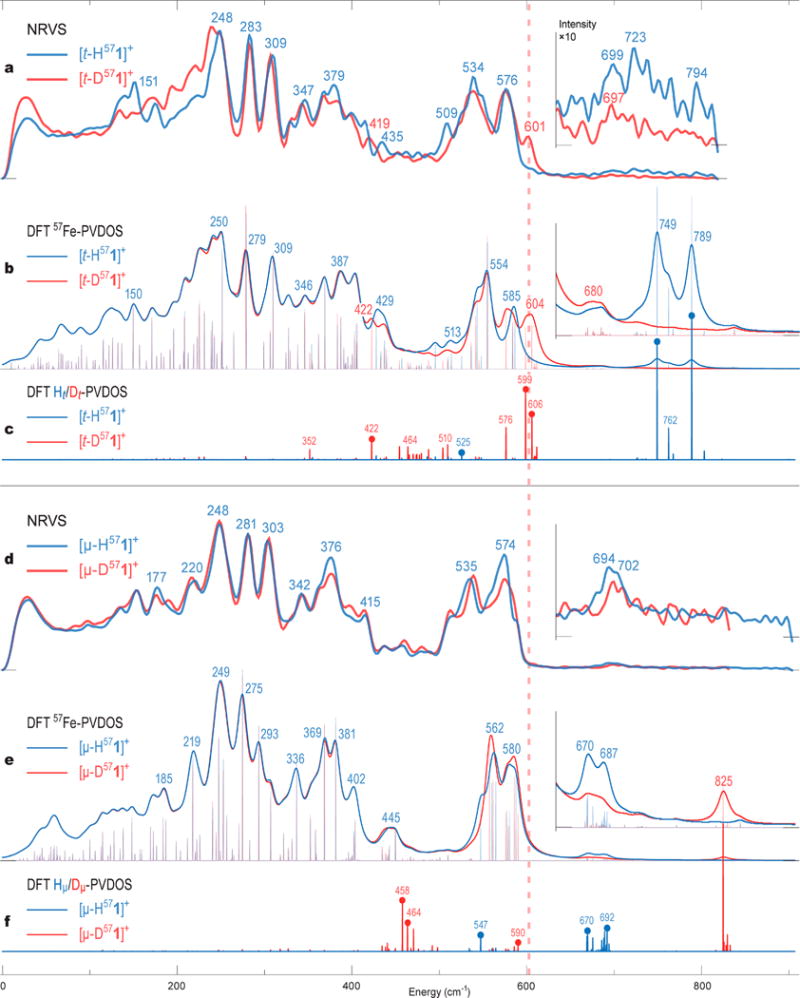
Figure 7.

57Fe-PVDOS vibrational spectra for the H/D variants (correspondingly in blue/red) of the terminal [t-H/D571]+ (upper panel, a, b) and bridging [μ-H/D571]+ (lower panel, d, e) hydride species characterized by NRVS experiments (a, d) and DFT calculations (b, e). The ×10 intensity insets display the spectra >620 cm−1. DFT-based stick-style spectra show PVDOS for the terminal Ht/Dt (c) and bridging Hμ/Dμ (f) hydrides and 2 × 57Fed/p (d, e) iron nuclei. The dashed vertical line at ∼600 cm−1 indicates the key difference between the [t-D571]+ and [μ-D571]+ spectra as explained in the text. The labels (cm−1) indicate band positions (a, b, d, e) or individual normal-mode frequencies (c, f). Mode positions marked with thick dots (c, f) correspond to significant H−/D− hydride motions; arrow-style molecular representation of these modes is available in Figure 8. See Figure S51 for alternative spectra arrangement and also DFT 57Fe-PVDOS for the d/p-conformers of the Me2pdt2− bridge.
