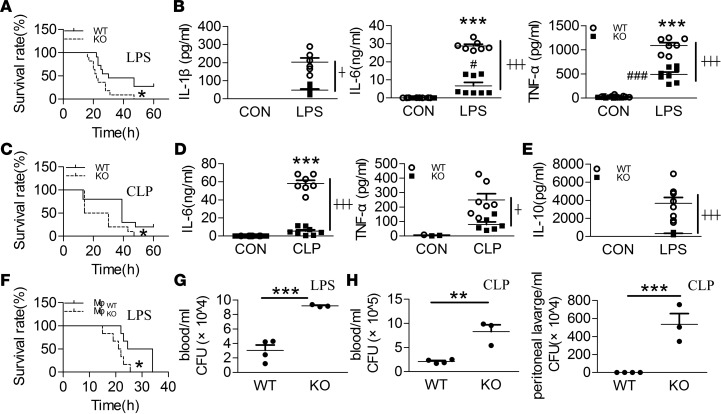
Figure 1. Swiprosin-1–KO mice exhibited higher mortality and immunosuppression after LPS- and CLP-induced sepsis.
(A) Survival curves after i.p. LPS (40 mg/kg) (n = 11, *P < 0.05, WT vs. KO), Log-rank (Mantel-Cox). (B) The levels of IL-1β, IL-6, and TNF-α in the serum after i.p. LPS for 6 hours (n = 6–8, ***P < 0.001, WT control (WT-CON) vs. WT-LPS; #P < 0.05, ###P < 0.001, KO-CON vs. KO-LPS; ┼P < 0.05, ┼┼┼P < 0.001, WT-LPS vs. KO-LPS), 1-way ANOVA (LSD test) ; the results are depicted as the mean ± SEM. (C) Survival curves after cecal ligation and puncture (CLP) treatment (n = 10, *P < 0.05, WT vs. KO), Log-rank (Mantel-Cox). (D) The levels of IL-6 and TNF-α in the serum after CLP treatment for 18 hours (n = 7 or 8, ***P < 0.001, WT-Sham vs. WT-CLP; ┼P < 0.05, ┼┼┼P < 0.001, WT-CLP vs. KO-CLP), 1-way ANOVA (LSD test); the results are depicted as the mean ± SEM. (E) IL-10 concentration in the serum after i.p. LPS for 6 hours (n = 8, ┼┼┼P < 0.05, WT-LPS vs. KO-LPS), 1-way ANOVA (LSD test); the results are depicted as the mean ± SEM. (F) Survival curves after supplementing with WT and KO macrophages in the macrophage-depleted mice after i.p. LPS (n = 6, *P < 0.05, WT-Mφ vs. KO-Mφ), Log-rank (Mantel-Cox). (G) Bacterial burden in the blood of the LPS-induced septic mice (n = 3, ***P < 0.001, WT vs. KO), 2-tailed t test; the results are depicted as the mean ± SEM. (H) Bacterial burden in the blood and peritoneal lavage fluid of the CLP-induced septic mice (n = 3, **P < 0.01, ***P < 0.001, WT vs. KO), 2-tailed t test; the results are depicted as the mean ± SEM.

