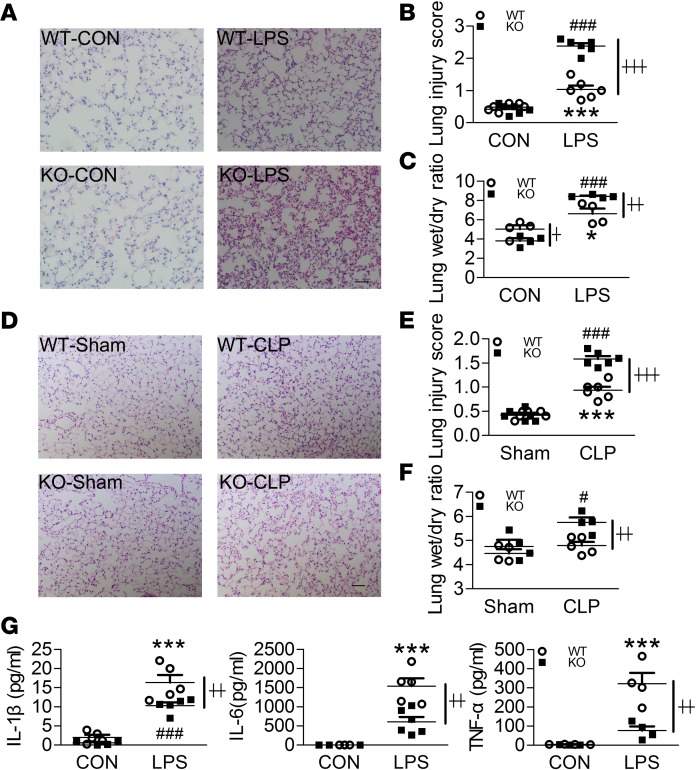
Figure 2. Swiprosin-1 deficiency aggravates the lung injuries in LPS- and CLP-induced sepsis.
(A and B) H&E-stained sections and injury scores of the lung after i.p. LPS for 6 hours (n = 6, scale bar: 200 μm, ***P < 0.001, WT-CON vs. WT-LPS; ###P < 0.001, KO-CON vs. KO-LPS; ┼┼┼P < 0.001, WT-LPS vs. KO-LPS), 1-way ANOVA (LSD test); the results are depicted as the mean ± SEM. (C) Lung W/D ratio after i.p. LPS for 6 hours (n = 4, *P < 0.05, WT-CON vs. WT-LPS; ###P < 0.001, KO-CON vs. KO-LPS; ┼P < 0.05, ┼┼P < 0.01, WT-LPS vs. KO-LPS), 1-way ANOVA (LSD test); the results are depicted as the mean ± SEM. (D and E) H&E-stained sections and injury scores of the lungs after CLP treatment for 18 hours (n = 6, scale bar: 200 μm, ***P < 0.001, WT-Sham vs. WT-CLP; ###P < 0.001, KO-Sham vs. KO-CLP; ┼┼┼P < 0.001, WT-CLP vs. KO-CLP), 1-way ANOVA (LSD test); the results are depicted as the mean ± SEM. (F) Lung W/D ratio after CLP treatment for 18 hours (n = 4–5, #P < 0.05, KO-Sham vs. KO-CLP; ┼┼P < 0.01, WT-CLP vs. KO-CLP), 1-way ANOVA (LSD test); the results are depicted as the mean ± SEM. (G) The levels of IL-1β, IL-6, and TNF-α in the bronchoalveolar lavage fluid (BALF) after i.p. LPS for 6 hours (n = 4-6, ***P < 0.001, WT-CON vs. WT-LPS; ###P < 0.001, KO-CON vs. KO-LPS; ┼┼P < 0.01, WT-LPS vs. KO-LPS), 1-way ANOVA (LSD test); the results are depicted as the mean ± SEM.

