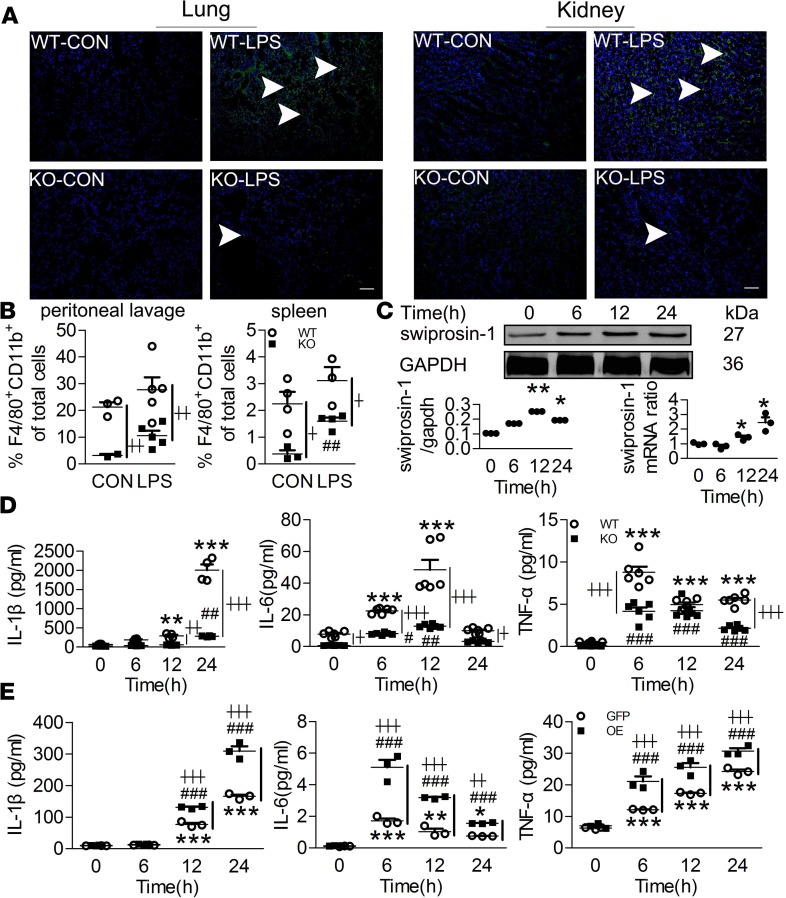
Figure 4. Swiprosin-1 deficiency restrains macrophage recruitment and attenuates proinflammatory cytokine production after LPS treatment.
(A) F4/80+ cells in the lung and kidney after i.p. LPS for 6 hours (green fluorescence, F4/80+ macrophage; blue fluorescence, nucleus; scale bar: 200 μm). (B) The percentage of F4/80+CD11b+ macrophages in the peritoneal lavage fluid and spleen after i.p. LPS for 6 hours (n = 3–5, ##P < 0.01, KO-CON vs. KO-LPS; ┼P < 0.05, ┼┼P < 0.01, WT-LPS vs. KO-LPS), 1-way ANOVA (LSD test); the results are depicted as the mean ± SEM. (C) The expression of swiprosin-1 in the WT macrophages after LPS treatment (n = 3, **P < 0.01, *P < 0.05 12 hours vs. 0 hour; *P < 0.05, 24 hours vs. 0 hour), 1-way ANOVA (LSD test); the results are depicted as the mean ± SEM. (D) IL-1β, IL-6, and TNF-α concentrations in the macrophages after LPS treatment (n = 4 or 6, **P < 0.01, ***P < 0.001, WT-LPS vs. WT-0 hour; #P < 0.05, ##P < 0.01, ###P < 0.001, KO-LPS vs. KO-0 hour; ┼P < 0.05, ┼┼P < 0.01, ┼┼┼P < 0.001, WT-LPS vs. KO-LPS at the same time point), 1-way ANOVA (LSD test); the results are depicted as the mean ± SEM. (E) IL-1β, IL-6, and TNF-α concentrations in the swiprosin-1 overexpression and GFP-control RAW cells after LPS treatment (n = 3, *P < 0.05,**P < 0.01, ***P < 0.001, GFP-LPS vs. GFP-0 hour; ###P < 0.001, OE-LPS vs. OE-0 hour; ┼┼P < 0.01, ┼┼┼P < 0.001, GFP-LPS vs. OE-LPS at the same time point), 1-way ANOVA (LSD test); the results are depicted as the mean ± SEM.

